In my last two projects, I have been working on Digital Marketing Data for my client’s friend. So, my client’s friend is my second client. He has an online business that relies on Google. Therefore, he has created a website and apps to run the business perfectly. He has been running this business for the past three years. Last year, I worked on some SEO tasks for him. Now, he requires some analytical results, which is why he reached out to me. As a Data Analyst, I have examined all the business strategies, including website and app traffic using the Ga4 dashboard. Ga4 is the latest Google Analytics tool designed to help measure and analyze website and app data, offered for free by Google.
In July 2023, Google introduced GA4 to replace GA3. GA4 is three times better than GA3 because it offers AI and Machine Learning capabilities. For example, I integrated a Google Ads account for my client to understand user search behavior, thus improving ad ROI. While Ga4 provides essential analytics, its dashboard is not optimal. On the other hand, Google offers Looker Studio, which is the best data visualization tool. Looker Studio is free, and I have created a Looker Studio dashboard using Ga4 data.
In this article, I will share my journey and explain why I use Google Looker Studio for creating Ga4 data analysis dashboards.
Why Looker Studio is the First Choice for Ga4 Data Analysis
There are several reasons why Looker Studio (formerly Data Studio) might be considered the top choice for GA4 data analysis. Both GA4 and Google Looker Studio are Google products, ensuring a smooth connection. When I first encountered my client’s data, I considered GA4’s data structure, including event-based measurement and user-centric metrics. Looker Studio’s dashboard facilitated my understanding of this data.
As a data analyst, I recognize that dashboards are crucial for presenting business insights. Business owners rely on data to make informed decisions, and Looker Studio provides the tools to achieve this. While Ga4 data can be intricate, Looker Studio offers a wide range of visualization options such as charts, graphs, and maps, transforming complex data into actionable insights.
Why Looker Studio Excels with GA4 Data
Data analysis involves extracting insights from data to make better decisions. Looker Studio excels in this regard, providing easy data integration for GA4 due to its status as a Google product. It offers advanced visualization tools, a user-friendly interface, and real-time insights, crucial for fast-paced decision-making.
How to Connect and Create a Looker Studio Dashboard Using GA4 Data
Connecting GA4 data with Looker Studio is straightforward. Ensure you have access to both Google Analytics and Data Studio. Follow these steps:
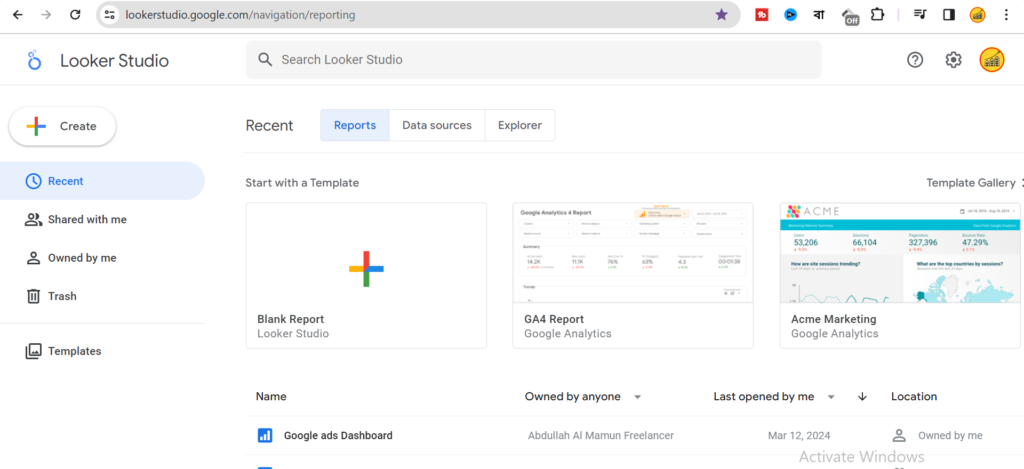
- Open Data Studio: Visit https://lookerstudio.google.com/ and sign in with your Google account.

2. Create a New Report: Click the “+” icon and select “Blank Report.”
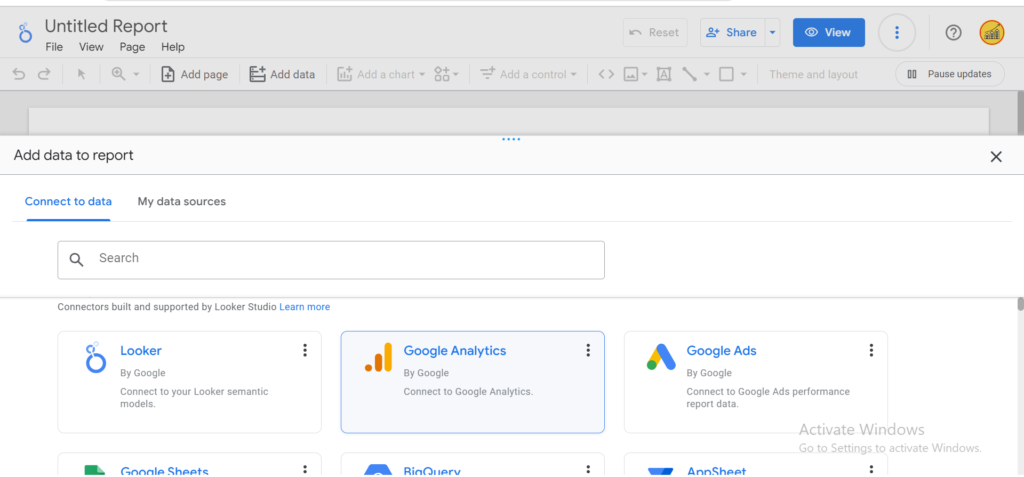
3. Add Data Source: Click on “Add data” in the top left corner.
4. Choose Google Analytics Connector: Select “Google Analytics” from the data source options.

5. Connect to GA4 Property: Choose the desired Google Account and select the GA4 property.
6. Connect and Explore (Optional): Click “Connect.” You can modify or create new data schemas if necessary.

7. Create Report: Click “Create report” in the top right corner.
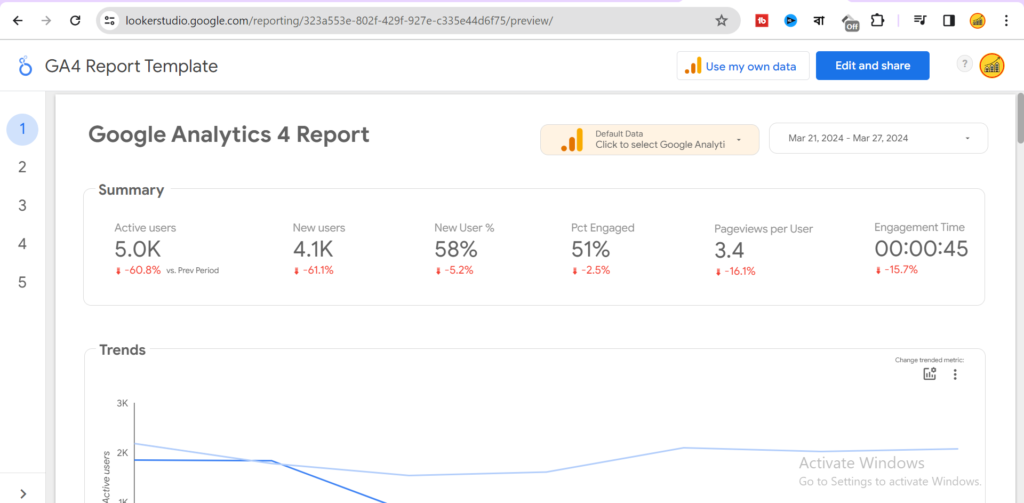
By following these steps, you can create a dashboard for Google Analytics. The challenge lies in organizing the data charts to provide meaningful insights for business decision-making.
If you lack the time to create such a dashboard, feel free to contact us directly. Our experts will assist you in building your dashboard.

