Data analysis is a field that helps every business or organization make informed decisions. For that, a data analyst needs to perform data analysis properly. After learning the skills of a data analyst, their job is to practice with data, experimenting with different datasets. Today, we will explore how to practice data analysis as a beginner. Before I got my first data analyst job, I worked on about 20 projects, and in each project, I discovered valuable insights related to real-life data.
However, those who have just started mastering data analysis skills may need access to real-life data, and no business will provide them with data for practice. But you can easily work with real data if you want. Working with real data is essential to provide valuable insights.
Today, I will share my practical experience and knowledge on how to practice data analysis as a beginner.
Data Analysis Practice with Excel
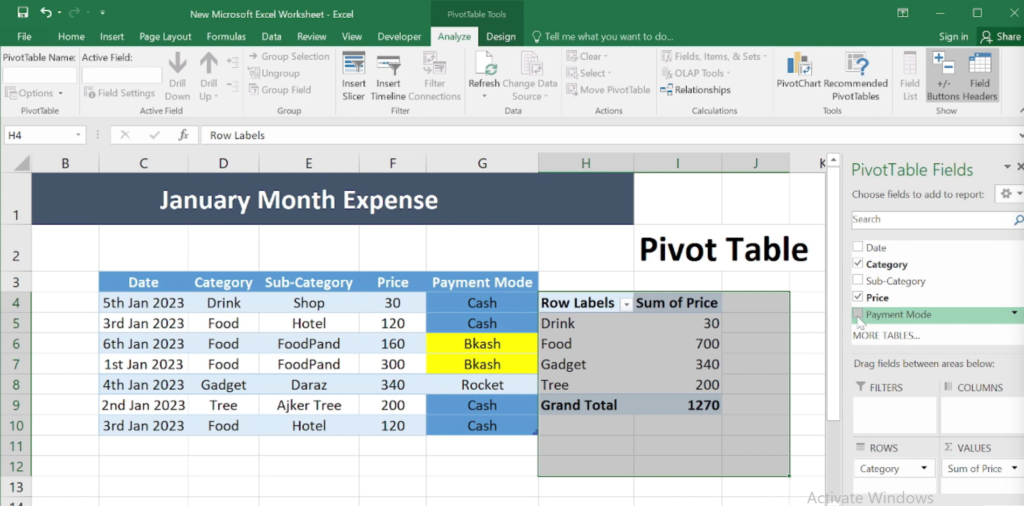
Excel is a fantastic tool for data analysis and is often considered the first tool to learn. In my case, I also learned Excel for data analysis, and I still use it every day. To become a good data analyst, it is crucial to know the fundamentals of Excel and practice data analysis using it. I will explain with an example of how to practice data analysis with Excel.

In the image above, we can see some data that I have organized in a pivot table. Although this is an example, the function of a pivot table is to summarize large amounts of data, which is a key aspect of data analysis.

As we can see, the pivot table allows us to find the sum of the products in a category with just one click.
Let me show you a small example. You can work with different types of data to practice data analysis with Excel and create a project as you work with each dataset. By doing this, you can use these projects as part of your portfolio.
Data Analysis Practice with Power BI
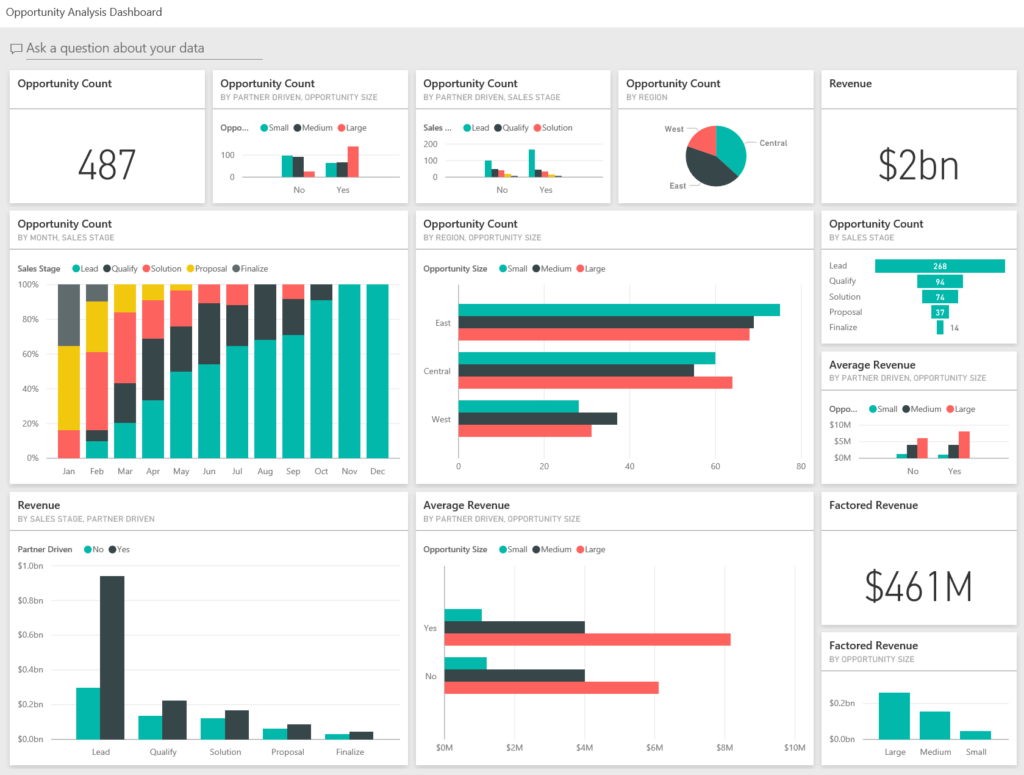
Power BI is a data visualization tool. You might wonder why use Power BI when Excel also offers data visualization. Power BI offers a user-friendly interface that caters to both data analysts and business users with varying technical backgrounds. Excel can be intimidating for non-technical users, while Power BI facilitates the creation of reports and visualizations without extensive coding knowledge.
I now use Excel for the visualization of small datasets, and when I work with big data, I use Power BI to visualize it.

Above, we see a business-oriented dataset in visualized form. There is usually not a lot of data here. You can take such raw data and visualize it. Power BI boasts superior data connectivity compared to Excel. It connects to a wider range of data sources, from cloud databases and CRM systems to Excel spreadsheets. In terms of data connectivity, Power BI is a few steps ahead of Excel.
Data Analysis Practice with Python
Python is an excellent choice for data analysis. Programming can make any task more convenient, and Python is a powerful tool for data analysis. By programming, you can analyze data very easily.
First, you will need to master Python programming. Start with small datasets and try to analyze them. Then, you need to understand the Data Analysis Workflow. Practice repeatedly to become efficient with data.
Python offers several libraries for data analysis:
NumPy: This library excels at numerical computing, allowing you to work with arrays and matrices efficiently.
Pandas: This library is essential for data manipulation and analysis.
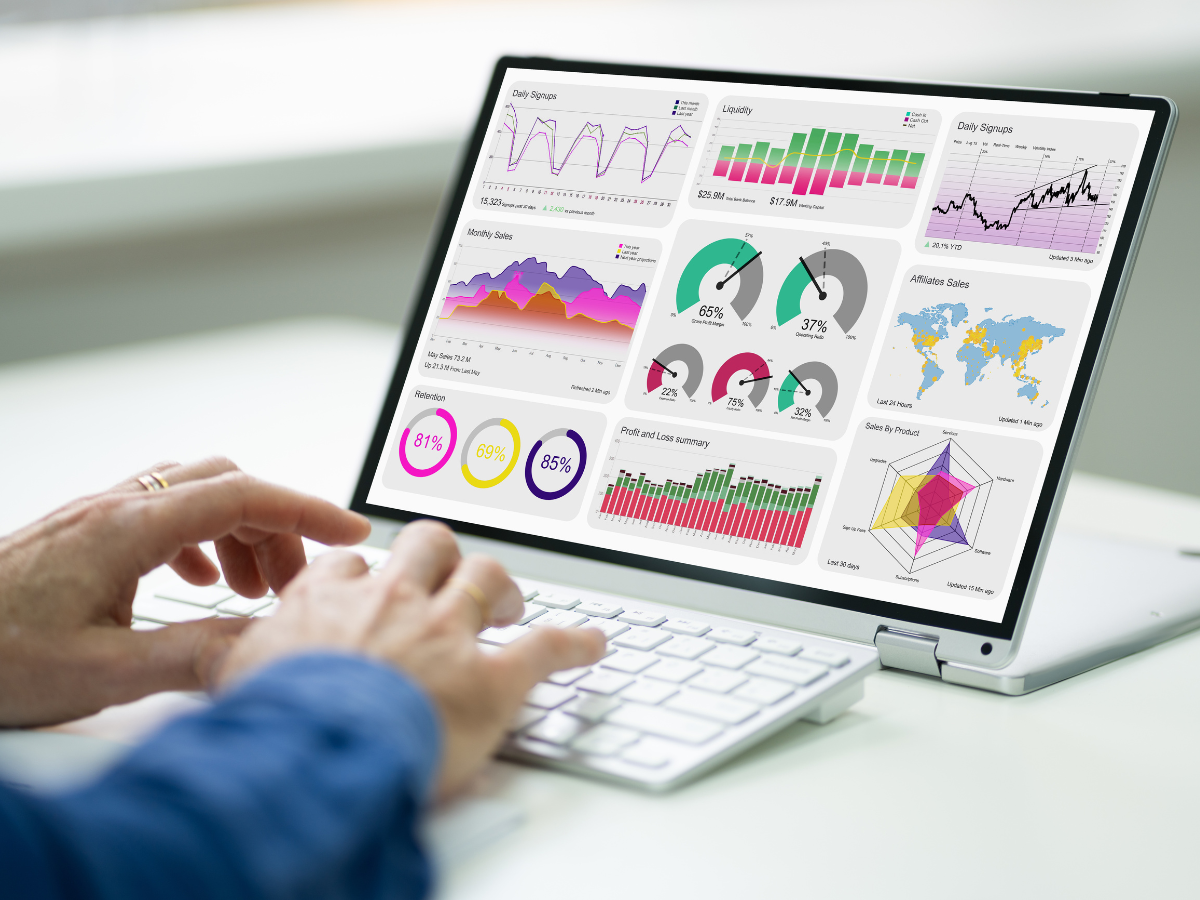
Matplotlib & Seaborn: These Python libraries help with data visualization. Matplotlib provides a foundation for creating various charts, while Seaborn builds on top of Matplotlib, offering high-level functions for creating attractive and informative statistical graphics. Practice creating different chart types like bar charts, histograms, scatter plots, and box plots to visually represent your data insights.
In the above discussions, we have explained how to practice data analysis. You can create a project in each case. For example, if you want to practice Excel data analysis, you can create a complete project that you can use as part of your portfolio.

