Data Analyst Education Requirements

Can you please answer me a simple question: in this day and age, is a formal education certificate required to get any IT job? For instance, I didn’t need to present any institutional education certificate to get my data analyst job. In my experience, if you are proficient in data analysis skills, you don’t need any certificate. When you are selected as a data analyst, only your skills are considered.

Let me share with you how I got my data analyst job without a degree and some additional tips to help you advance your career.

How I Got a Job as a Data Analyst Without a Degree

A few years ago, I began learning about data analysis. In a few weeks, I acquired some data analysis skills and continued applying for data analysis jobs. Despite applying to over a hundred job applications, I had no success. Junior Data Analyst and Entry Level Analyst positions are highly competitive, so if you can’t present yourself effectively or in a unique way, securing a job can be challenging. This was my experience.

Then I focused on honing my skills. I worked on a few projects based on the skills I had learned. I completed a real-life project analyzing the last 15 years of government formation in all Asian countries. This project helped me secure my first job. It’s important to note that you don’t need any certificate or educational qualification for the job. The most important factor is the number of projects you’ve completed and how authentic they are to you. When you showcase these projects as part of your portfolio, it creates a positive impression.

I have briefly explained how I got my data analysis job. To stay ahead, you can take any institutional course and present the certificate from that course as I did for my job.

Well, I learned a few things on my journey to take this job:

  1. Taking a Right Data Analysis Course
  2. Data Analysis Skills
  3. Work for Project and Make Portfolio
  4. Make Network

Taking the Right Data Analysis Course

An important point here is that you should take a course to learn all the fundamentals of analysis.

Choosing the right data analysis course is crucial for getting the most out of your learning experience! To help you narrow down your options, here are some things to consider:

Your Background:

  • Beginner: If you’re new to data analysis, focus on courses that introduce core concepts like data collection, cleaning, and analysis methods. Look for courses that use beginner-friendly tools like Microsoft Excel or Google Sheets.
  • Intermediate: With some data analysis experience, you can delve deeper into specific tools and techniques. Courses on SQL, Python for data analysis, or data visualization can be valuable options.
  • Advanced: For experienced data analysts, consider specialized courses on data mining, machine learning, or business intelligence tools like Power BI.

Data Analysis Skills

But in the discussion above, I have discussed what skills you will learn and I have also divided them into three parts: what skills you need to learn at intermediate and advanced levels. In my case, I first learned Excel. After learning Excel, I learned a data analyst tool from Google called Google Data Studio. And I completed some digital data analysis projects with Data Studio.

But I think the best way is if you can follow the above three steps to finish learning the beginner level skills first. Then you will learn intermediate level skills, and finally, you will learn advanced level skills.

Work for Project and Make Portfolio

Your personal projects and portfolio are more important than the educational requirements to get a data analysis job. For example, if you have a real-life project, you can use it for a data analysis job like I did a project where I analyzed the political situation of Asian countries. So, I think that’s a great approach! Building a portfolio of data analysis projects is an excellent way to showcase your skills and land that data analyst job.

Finding Project Ideas:

  • Public Datasets: Numerous websites offer free, high-quality datasets on various topics. Explore Kaggle, UCI Machine Learning Repository, or Data.gov to find datasets that pique your interest.
  • Freelance Platforms: Look for freelance marketplaces like Upwork or Fiverr for data analysis gigs. These can provide real-world experience while adding to your portfolio.
  • Volunteer Work: Consider volunteering your data analysis skills to non-profit organizations or local businesses. They might have data they need analyzed but lack the resources.
  • Personal Projects: Think about your hobbies or areas of interest. Can you use data analysis to answer a question or solve a problem related to them?

Make Network

Many data analyst positions are filled through internal referrals or connections. By networking, you get introduced to potential employers who might not be advertising open roles. Networking is a fantastic way to boost your chances of landing a data analysis job.

Networking connects you with people who can provide valuable insights into the data analysis field. They can share trends, in-demand skills, and advice on how to position yourself for success.

Conclusion

Now you might have understood from the above total discussion how important educational requirements are for getting data analysis jobs. But I have shared my personal experience in this entire article. So you will not be too disappointed to get your job. Try to organize your journey according to the strategies I have discussed above. You will find your desired job very easily.

How much time is needed to learn data analysis for a job?

Imagine the distance from your house to the shop is 2 km. If I were to tell you how much time it would take to cover this two-kilometer distance, you might inquire about crossing the road or the mode of transportation—whether by car or by foot. Opting for a car would result in less time spent, while walking would require more. If you’re familiar with the route, you’ll likely already know whether to walk or drive.

You might find the subject somewhat intriguing. The reason for giving this example is to help you understand how much time is needed to learn data analysis for a job. Given the world’s heavy reliance on current technology, with all activities being tech-driven, data holds immense importance.

Hey, the methods you will adopt to learn data analysis are also a key issue. Like if I tell my story, it took me three months to learn data analysis. And I personally developed some projects, and easily I got the job. So today, I will share with you my personal experiences and how you too can easily go through this journey and get a job after learning data analysis.

What do data analysts do?

Let me give you an example of the place where I am currently working. I work for a local business that sells products online. The sales of some of their products decreased last month. Now my boss came to me and told me to analyze why the sales of our product decreased. I have analyzed that some of our competitors have been created in the market. Some customers have left us for this.

So we started a campaign on that product, and we started showing ads to people in that area and gave a 10% discount, and then we solved this problem. This total process was made possible by the fact that we had data and could analyze that data. And I have done this analytics work using only two software: Excel and Power BI. If I explain to you why I use Excel: because when I analyzed this data, I did it with Excel because there was not much data, I had a total of 3000 data. That’s why I use Excel, and after doing this whole analysis, I created a dashboard and visualized all the things. There, I used Power BI for that.

What do you need to know to get a data analyst job?

First of all, different companies have different requirements. People who work with big data will tell you about doing data analysis in programming languages. After all, the work of all the tools is the same; you can do analysis with all of them. But what matters is what tools you have to work with at what time.

For example, when I work in science, I do data analysis with Python. But Excel will help you very well to do basic data analysis. To get a job, you need to know the working of almost all the tools, but to get a country-level job, you need to know Excel and Power BI.

What to start learning?

Before I learned data analysis, I could work fairly well in Excel. For example, I used to create different types of accidents and used different types of calculations in Excel. I used to do such tasks with Excel. And when I started learning data analysis, I started data analysis with Excel, and I also request you to start data analysis with Excel. Then your learning journey will be much easier. Suppose you are given a data set and asked to clean it. You will have an idea of the data when you can clean it with Excel.

Undoubtedly, Excel is a simple tool. When you understand all the concepts about data using Excel, it will be much easier for you to learn the rest of the tools.

Learn Power BI

When you do analysis, you need to convert that data into a dashboard. Because that dashboard, you will visualize the data; you will present the data in the form of various charts and graphs. That’s why you need to learn with power. Currently, Excel is very popular and is a tool to manage everything easily. Currently, I build 70% of my work data dashboards with this Power BI.

Learn Python

When you use any programming language in the real world, you must assume that the task is done several times easier. When you work with large data sets, you can’t easily read without programming. Suppose you have 10 lakhs of data, the easiest way to analyze that data would be Python programming.

To give you a small example, in a recent project, I used Python programming; I created a visualization with just two lines of code. But on the other hand, if I were to do this in Excel, it would probably take me over 30 minutes.

If you can learn these three tools well, then you will be job-ready. And you can easily get a job. I learned these three tools to get my first job, and I got the job I wanted.

Prepare yourself to get a job

There isn’t one single secret to data analysis, but rather a combination of best practices and approaches that lead to successful insights. Here are a few key aspects to consider:

  1. Understanding the Data: Before diving into analysis, it’s crucial to grasp the data’s origin, format, and any potential inconsistencies. This helps in cleaning and manipulating the data effectively.
  2. Asking the Right Questions: Data analysis is driven by clear questions. What are you trying to learn or achieve? Formulating the right questions guides the analysis process and the choice of techniques.
  3. Data Wrangling: Most data isn’t perfect and often requires cleaning and organization. This might involve handling missing values, outliers, and ensuring consistency in formatting.
  4. Visualization: Charts and graphs can reveal patterns and trends that might be missed in raw data tables. Choosing the right visualizations effectively communicates insights.
  5. Beware of Biases: Our own perspectives can subconsciously influence how we interpret data. Being aware of potential biases helps in maintaining objectivity during analysis.
  6. Focus on Context: Data doesn’t exist in a vacuum. Consider the context in which it was collected to ensure the inferences you draw are meaningful.

After all, learning data analysis, you will work on some projects. Because when you can show these projects as your portfolio, getting a job will be much easier. And if you are a technology lover and can sit in front of computer for four to five hours every day then you will become a good data analyst within 6 months.

How Can I Learn Data Analysis Skills for Free?

In this tech-driven era, education is entirely free. Ten years ago, when considering learning a skill, the first thought was its cost. And you calculated whether you could afford it. In my experience, when learning about computer basics, I paid $100. Truly, this amount was very high for me at the time. But now, you can learn rocket science entirely for free.

You can access all the information online and learn at your own pace. So, learning data analysis skills is similar. There are many ways you can learn data analysis skills for free. In my case, I learned 80% of my data analysis skills online for free. So, I think it would be a significant advantage for you. Because I have acquired data analysis skills for free, I can provide you with excellent guidance.

Before learning any skill, you must know why you want to learn that skill and what it entails. So, there are no exceptions to data analysis; we did not know these topics before.

What is Data Analysis?

A data analyst can be defined in many ways. But if I want to explain it very simply, a data analyst is someone who can easily make decisions from a bunch of data or turn data into action. For example, I work in data analysis at a local company. They have 5000 sales data. My company boss came to me and asked me to extract insights from this data that would target our old customers, and I would create offers for those who have bought more than 10 times from us. This is what I did with data analysis.

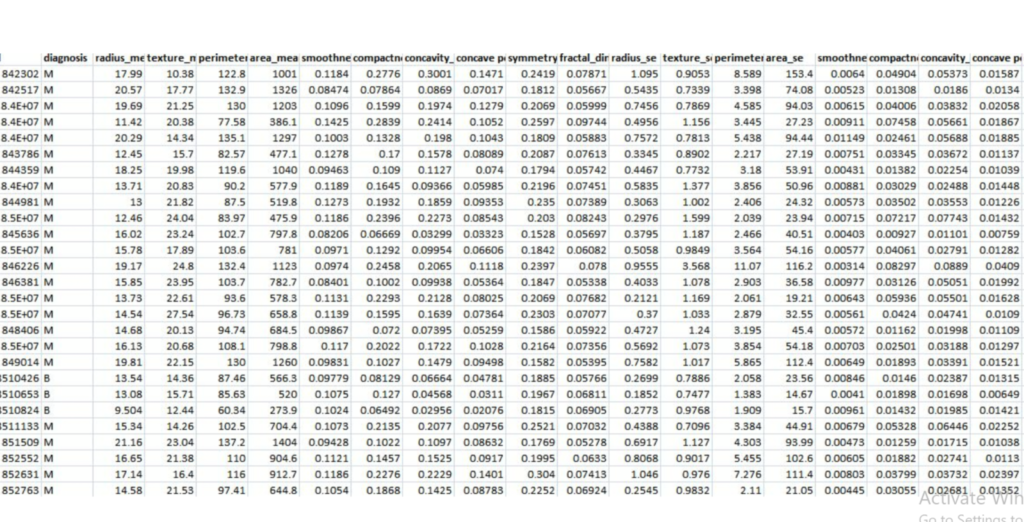
Well, if I ask you to look at this dataset and tell me what you actually understand, can you make any decisions from this data? No, you can’t make any decisions because you don’t understand anything from here. If I push you, you might say yes, I see some numbers here. But you can’t say what they actually are. However, when I analyze this data, bring out some insight, organize the data part by part, then you can easily tell what this data was for and what kind of action we can take from this data. I think you have no doubts about data analysis.

Which Skills are Needed for Professional Data Analysis?

As I have been working as a professional in this field for several years, I can analyze any type of data very easily. From my practical experience, I can now tell you which skills are most important for your data analysis.

Since we are discussing today how you can easily learn data analysis skills for free, I will suggest that you learn these skills in three stages. Like in the first stage, you will learn the basics and start working on some projects. Then you will learn some more skills to work at an advanced stage, and to work at the professional level, you need to learn some advanced tools along with programming.

Conquering data analysis can seem daunting, but with a strategic approach, you can acquire these valuable skills for free! Here’s a breakdown of the learning journey in three stages:

Learn Basic Data Analysis:

  • Excel for Data analysis
  • Google Sheets for data analysis.
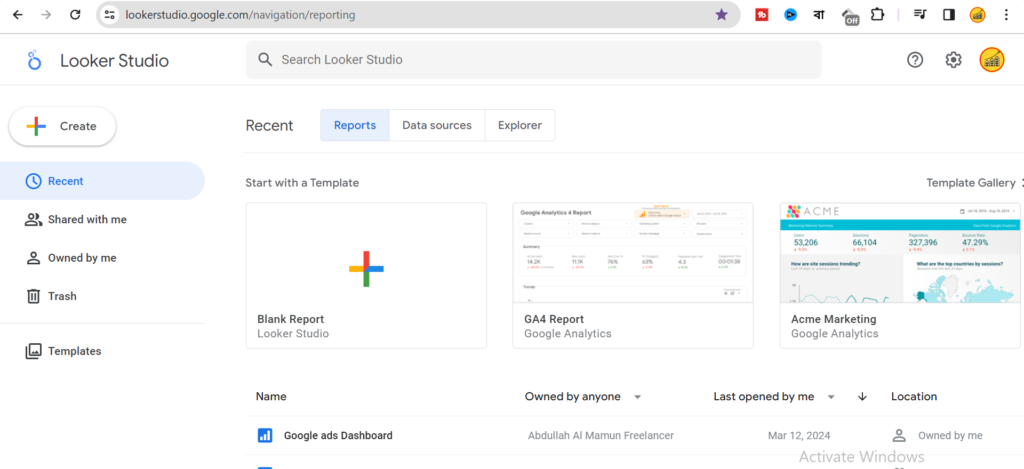
  • Google Looker Studio for Data Visualization.

When you start learning data analysis skills, you will firstly learn these three tools. You can learn these tools in a short time. Then you will understand all the data concepts. For that, you can work on live data projects. Projects help you understand data.

Learn Advanced Data Analysis:

When you finish basic data analysis skills, then you can add some skills which you upgrade advanced data analyst.

  • PowerBI
  • Python

At the advanced stage, you will start learning Power BI and Python to perform data analysis. Power BI is a very popular tool for data visualization, and the Python programming language gives you multifold performance in any task. Similarly, the Python programming language for data analysis will increase your work speed several times, and you will start working with big data. When you learn PowerBI and Python, you will do some projects on them. By doing this, the data concepts will start getting clear to you.

Learn Professional Data Analysis:

You are now familiar with many tools for basic and advanced data analysis. Now you can do your tasks at super-fast speed. But what you need to know to work at a professional level are:

  • Statistics
  • SQL
  • Problem-Solving
  • Critical thinking

As you progress, explore advanced data analysis tools like SQL for querying databases and data visualization libraries for creating impactful charts. Many free resources and tutorials are available online. I will write about it.

Data analysis is a dynamic field. Keep yourself updated with the latest trends and technologies by following industry blogs and attending free webinars or meetups.

Free Courses, Resources, and Videos for Learning Data Analysis

Technology is improving day by day, and there is nothing outside of learning to stay ahead in our technology. We have to keep learning. As we’re discussing how to learn data analysis for free today, if you’ve stayed with this article so far, apply these methods to any skill you’ll learn in the future.

Excel For Data Analysis: Data Analysis In Excel | Simplilearn

This Excel Data Analytics Full Course video will help you understand the various crucial functions available in Excel, such as lookup, H lookup, sumif/s, countif/s, if error, and others. Finally, you will see how to use the Data Analysis Toolpak to perform various data analysis operations. So, let’s begin.

Google Looker Studio: Google Data Studio Tutorial.

Learn how to use Looker Studio to create reports and dashboards. Looker Studio tutorial for beginners; you will learn how to create your first report, including adding a data source, adding and customizing charts, adjusting styling, and more. Let’s get started!

Data Visualization With Power BI: Great Learning.

Learn Data Visualization with Power BI from basics in this free online training. Great Learning offers a free course for learning PowerBI Data Visualization. This course offers you a free certificate. After completing this course, you can get a certificate. It’s really amazing.

Python for Data Analysis: Great Learning. Link.

Great Learning Offers you Python for Data Analysis course to advance your career in the in-demand field of data analysis. To do well in data analysis, you must learn a programming language. Python is a User-Friendly Language, so you can learn python easily.

SQL for Data Analysis: Chandoo.

SQL is one of the most important skills to have for data people. In this comprehensive video, learn how to use SQL to perform common data analysis tasks. If you don’t know anything about SQL, then you can learn it very easily by taking this course.

Statistics For Data Analysis: FreeCodeCamp.

This course introduces the various methods used to collect, organize, summarize, interpret, and reach conclusions about data. I think this course is very good for statistics. When I saw this course, I didn’t know about basic statistics, but now I know better.

Conclusion

Finally, I would say you can use online platforms for data analysis, and you can learn for free. But if you follow a mentor, then you can learn these skills very easily. If I speak for myself, it took me a while to learn these skills. But when I started teaching data analysis skills to my younger brother and I mentored him, he learned data analysis in half the time I did.

How to Practice Data Analysis


If you don’t practice the skills you just learned, you won’t master them. Similarly, data analysis is no exception. You always have to tinker with data analysis tools. However, if you can work on real projects, you can take your skills to a unique level. Today, we’ll discuss the best practices in data analysis.

I always write based on my personal experience. My journey to mastering data analysis skills was very challenging. Those new to the field of data analysis can benefit from my experience.

To thrive in the world of big data, you must master different tools. One important aspect is domain knowledge. If you want to conduct data analysis on a topic you excel at, that field is the one for you. For example, a friend of mine was an HR professional who later became an HR data analyst after my guidance. He now has a vast network and has taken his career to the next level as an HR data analyst. Similarly, you can build a data analysis career based on your domain knowledge, such as medical data analysis, HR data analysis, business data analysis, digital data analysis, and so on.

Let’s begin practicing data according to our domain knowledge. This will enable us to work in any field. Here’s how we can start putting data analysis into practice.

After Learning Data Analysis Skills

In previous articles, we discussed the tools needed to perform data analysis. Today, we’ll discuss how to practice data analysis. For instance, you need to know some basic tools for data analysis, such as Microsoft Excel and Power BI. If you want to perform advanced work, you should learn Python. Based on these fundamentals, we will discuss below how to practice data analysis.

Work on Data Analysis Real Projects

Regardless of how much you practice data analysis, if you don’t work on real projects, you won’t gain good control over your skills. That’s why I recommend working on real projects to practice data analysis; these projects will boost your confidence. Many people wonder where to find real data. By “real projects,” I don’t mean taking data from any company or working for an organization.

For example, suppose I ask you to select 50 countries, find the unemployment rates for those countries, and prepare a report explaining why the last five countries have the lowest unemployment rates. This is a real project. By regularly working on projects like this, you will begin to master the skills effectively.

Kaggle, a platform for data science competitions, offers datasets and competitions for practice. You can also work on personal projects or contribute to open-source projects on platforms like GitHub.

Explore Data Visualization for Data Analysis

After analyzing data, visualizing it is a challenge. Have you ever made a mind map? If not, I recommend looking up how to create one. Similarly, when you turn numeric data into visualizations, you can make decisions more easily from a data dashboard. When practicing with data, create a data dashboard after completing the analysis.

How Google Can Help You Practice Data Analysis

Did you know that Google often collaborates to perform data analysis? You can use real data from Google to practice data analysis. Google Data Search and Google Public Data provide data sources for practice.

You can connect data from these sources and perform analysis. When practicing, document your work and post it on Kaggle or GitHub.

Uploading your files to these platforms creates your portfolio. Creating a practice data portfolio can enhance your career opportunities.

Conclusion

The more you work with real data and create projects, the more experienced you will become in the world of data. In truth, the projects you create will strengthen your portfolio. Thank you, and stay updated with us.

How Can I Learn Data Analysis Skills Easily?


If you have read my previous posts, you will understand that I only share my practical experiences. In today’s article, I will discuss how one can learn data analysis skills very easily. I’ve scoured various articles online talking about different tools, suggesting multiple tools for the same job. Well, can you tell me why I would take help of multiple tools for a small task? Let’s say, why should I do programming for the work that can be done with Microsoft Excel? When such questions come to our mind, we stop in the journey of starting data analysis.

To be honest, when I started doing data analysis, that means when I was working with Excel, I didn’t know that I had completed many tasks that were a field of data analysis.

Later, when I started learning about data analysis and when I started knowing that future analysis could be a very big opportunity, I started mastering the skills of data analysis. I started learning different tools based on the scope of work. If you are a newbie in the data analysis field, then what tools or things do you need to learn first? Today, I will give you a clear idea of how to learn data analysis skills easily.

Well, first of all, we don’t know that there are many processes in the world to learn data analysis and in what ways you can master data analysis skills. With this, I will share my practical experience of how I learned data analysis.

How Many Paths Are There to Learn Data Analysis?

Generally, the first thing that comes to our mind for learning something is to get a degree. So no doubt, we can get a degree in Data Analysis. We can get a degree in three to four years in any institution. I can master the skill of analysis by participating in various online or offline boot camps. And nowadays, the easiest way is to learn from online. This means you can master data analysis skills at home by taking an online course.

The easiest and free of charge way you can learn data analysis is by watching YouTube or various blogs.

Then, we got to know that there are a few ways in the world through which you can master the skills of data analysis:

  1. College Degree
  2. Bootcamp
  3. Online Course
  4. YouTube / Blog

Well, we have come to know these ways that we can master the skills of data analysis by adopting these ways. Let me tell you from my practical experience, which path I took and how I learned my data analysis skills easily.

If you’ve read my previous blog posts, you’d have an idea about me that I’m not a tech major. When I was first working part-time for a business company, I was working there with Excel. Later, I started data analysis when I realized that I had a good desire to learn data analysis. That’s why I didn’t attend any college degree to learn data analysis.

Then, we discussed boot camp. I attended a few boot camps on data analysis, in which I could get the basic idea about data analysis. Therefore, I will also tell you that you can attend as many free online boot camps as possible to get new updates and knowledge.

The next learning method is online courses. I learned most of the data analysis skills from online courses. As I was new to this field and had no prior experience in data analysis, I attended online courses from where I started learning and practicing all the fundamentals of data analysis.

In this current technology-dependent time, I would suggest that if you want to learn data analysis skill very easily, then an online course can be a better option for you.

YouTube or blog posts can be good mediums for you to learn data analysis skills, but if you know about the fundamentals or basics of data analysis, then YouTube and blog posts can help you. However, if you are totally new, then don’t expect much from YouTube. Sometimes, what you need to learn and why you need to learn these types of things are not well covered on YouTube. Simply put, YouTube or blog posts cannot give you the right mentorship.

Should I Learn a Programming Language before Data Analysis?

I personally know a lot of people or my friends have had such a case that they started learning programming as soon as they entered the data analysis field. I disagree on this point. Because if you learn the fundamentals of data analysis or the structure of analysis and work on a few projects, then you will know about the fundamentals of data analysis. Then if you learn programming, then you can directly implement the coding knowledge.

That’s why I would always tell you that if you are new to the field of data analysis or want to master data analysis skills easily, you should finish learning Excel, Power BI, and Google Looker Studio and do some projects using these tools in which you will use your Master the fundamentals of data analysis.

Once you are done learning these tools, you can start programming. I suggest you start with Python because you can learn Python very easily and you can work with real data very easily with Python.

Like I first started doing data analysis with Excel, then I learned Power BI and completed several projects with Power BI. Then, I came to know that learning programming is important for me now because I will now start working with large datasets. For this, I started learning Python.

How Can You Get Projects or Jobs while Learning?

Let me tell you in simple terms, no matter how well you master the skills, you will never become a good data analyst if you don’t start working in real life. That’s why you should start doing projects by learning Excel and Power BI first. For this, you may start doing freelance projects or work in a company so that you can progress very easily.

For example, after learning Excel and Power BI, I used to take projects from freelance marketplaces and complete them. Among the popular freelancing marketplaces currently, Fiverr and Upwork are very popular. The biggest motivation is money. Once you do a few projects and the money starts rolling in, you will be more interested in learning.

Conclusion

Well, if you think about it now, in this whole article, I tried to tell you a lot with my practical experience. I think in this data analysis journey what you need to do first, what tools to learn, how you can do well in your journey, you know all the things. If you have any questions, you can comment. Thank you.

Excel knowledge is important for starting the data analysis journey

Nowadays, in this age of data, people who don’t know about Excel are very rare, but experts in Excel are even rarer. Currently, any business can easily attract customers by analyzing its previous data, so data analysis is crucial. Well, the computer handles all the calculations, but we learn with Excel. For example, three years ago, I didn’t know there was a field called Data Analysis or Data Science; I was just doing various calculations with Excel.

At that time, I was working part-time for a company. There, I used to create different Excel sheets for their sales accounts. Then, when I started learning about the field of data analysis, I began my journey with Excel, and still, I spend most of my work time in Excel. You might understand a little about how important Excel is for data analysis based on my practical experience.

In today’s article, we will explore how important Excel is to start your data analysis journey.

Is Excel more advanced than other tools?

I wouldn’t say that Excel is an advanced tool for data analysis. However, over time, Excel has become more advanced and allows us to perform many advanced functions for data analysis. There are many tools such as PowerBI, Tableau, Google Looker Studio, Python, and R, which are good for analysis. But you need to understand what kind of data analysis you are going to do.

For example, if you have large-scale data, then you might consider using a programming language like Python or R. If you have mid-level data and want to create comprehensive dashboards for easy data insight, you can use PowerBI or Tableau. And for digital data such as Google Ads data, metadata, and Google Analytics data, tools like Google Looker Studio will assist you in analyzing this data.

A friend of mine who works in a local business company told me that the data they have can be categorized as mid-level data, and they still use Excel most of the time to analyze this data. They also use additional tools to extract more insights.

Now, let’s discuss some important skills to have at the beginning of your data analysis journey.

Working with data in Excel

I assume you are familiar with handling data in Excel. Data gathering, processing, and cleaning are essential processes for data analysis. First, we need to understand why we want to perform data analysis, i.e., how this data will help us. Then, we collect the data, clean it, and determine which data will be helpful.

Next, we work to extract data insights to identify business opportunities easily. We can create dashboards to understand the data conveniently, and all these processes can be done in Excel. However, when dealing with big data, Excel might not be sufficient.

If we want to analyze data in Excel, it offers us more than 100 functions and formulas to analyze the data effectively.

Conclusion

By now, you probably understand that Excel is essential for starting your data analysis journey, as I shared my personal experiences with you. When I started working with Excel, I didn’t know what data analysis was. Later, I learned and used my Excel experience for data analysis. I also encourage you to learn the basics of Excel first and understand which functions or formulas to use for data analysis. So far, thank you for considering this important topic today.

I have increased my business 5 times through data analysis


Today, the business world is very competitive. I do not come from a business family. Firstly, I started my career on the tech side. I learned about coding, and at that time, I worked as a web developer. Then, I realized that I needed to start a business. So, I have 3 years of business knowledge. In the last 1 year, I worked on data analysis for my business, and then I gained some advantages from my data.

If you have a digital business, then you must understand your data well. Doing data analysis has helped a lot in my business. And that’s why I will share my practical experiences here.

Getting to Know My Business Customers

The product I used to sell in my business was a physical product. But I had many competitors in the area where I set up my business. My business was a digital business, and most of the competitors were permanent stores. At that time, I didn’t realize that so many people were visiting my website or my Facebook page, but still, my product conversion rate was very low. And in this case, when I analyzed my Google Analytics data and Meta Ads data, I realized that my products had some problems that permanent stores could solve.

I worked on my product development, made price variations, and effortlessly my business started growing. This entire work was done only by doing data analysis to solve my business problems. I am talking about my experience. I have sold more products in one month after data analysis than what I could have sold in six months.

Knowing about Google Ranking by Analyzing SEO Data

You must know that if a website is in Google ranking, then you don’t have to spend anything extra to get traffic. And business continues to develop very well. I am an SEO expert myself. I think if you analyze your SEO data, then you will know about the ranking factors of your website.

Better Ad Campaign

I don’t run many ad campaigns for my products, but I do run ads to create specific offers. However, the ad copies I use are related to my product, but not to make my audience 100% interested. And I can understand this whole thing by analyzing my data because at that time, there was no problem with my product, but after seeing my ad copy, people came to buy very few products. Later, I changed my copy.

Product Cost and Management

When I started my business, I did simple market research and made product cost and product management. But I had many competitors in the area where I set up my business. My business was a digital business, and most of the competitors were permanent stores. So they are my business’s big challenge.

That’s why when I do product analysis, I readjust product management and product pricing so that I don’t have too much distance with my competitors.

It was my business plan to go my product is very simple, and most people are good with my product. Data analysis is the primary thing for every business word. In my personal and practical experience, understanding data is more helpful for our business.

Benefits of Data Analysis

I think at this stage, you know about the benefits of data analysis. So I share some key points with you. Analyze data to understand customer behavior, marketing effectiveness, operational efficiency, etc. It’s all a part of informed decision-making. Then you know all things about Improved Targeting like Data helps identify high-value customer segments. And lastly, a business understands about Reduced Costs, which help you identify areas for waste reduction and streamline processes based on data insights.

Getting Started with Data Analysis for Business

I have shared my entire practical experience in this article. Based on this, you can analyze your business data by following these steps.

  • Identify Goals: What aspects of your business do you want to improve?
  • Data Collection: What data do you currently collect, and what additional data might be useful?
  • Data Analysis Tools: Explore free or affordable options to get started.

Conclusion

Overall, data analysis is a valuable tool for business growth, but it’s not a magic bullet. But it is true that by doing data analysis, you can fully understand your data. Then you can take your business to several times more development phases.

If you need to analyze any such business, then you can definitely talk to us to know about the data. Stay with us, thanks.

How to Grow Your Business with Google Looker Studio

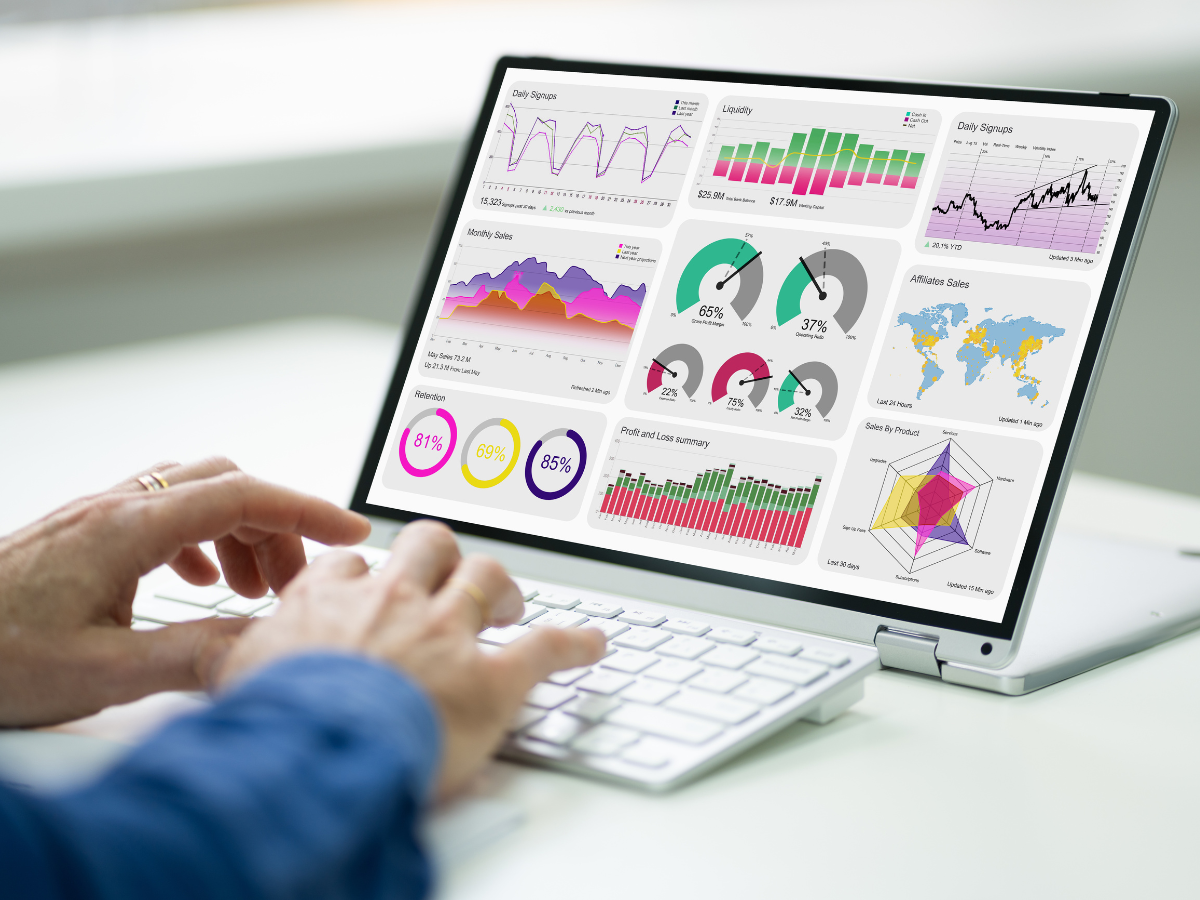
I think, you know about data dashboards. Well, when you see a data dashboard, it really helps you make better decisions. Do you know why it happens? When you see a dataset with 100 rows of data, you might get frustrated because you don’t understand everything easily. But on the other hand, when you see a dashboard where all the data is presented in front of you in the form of charts, you can easily understand everything from there.

I think you have business data or you’re creating business data, so you have all the data as a dataset, not in dashboard format. When you create a visualization dashboard for your business data, then you can understand it all. Like at present, by making decisions on what is happening to your business and what could happen to your business in the future, you can improve your business going forward. For all that work, it can be easy to do when you use Looker Studio for data dashboard making or data visualization.

As a data analyst and Looker Studio expert, over the course of a year, I’ve built several Looker Studio dashboards. Through these dashboards, a businessman can easily understand the facts of his business and make decisions on what he needs to do next.

So in this article, I will share my practical experience with you on how you can grow your business with Looker Studio. So you can stay with me, I promise I will share my best.

What is Looker Studio?

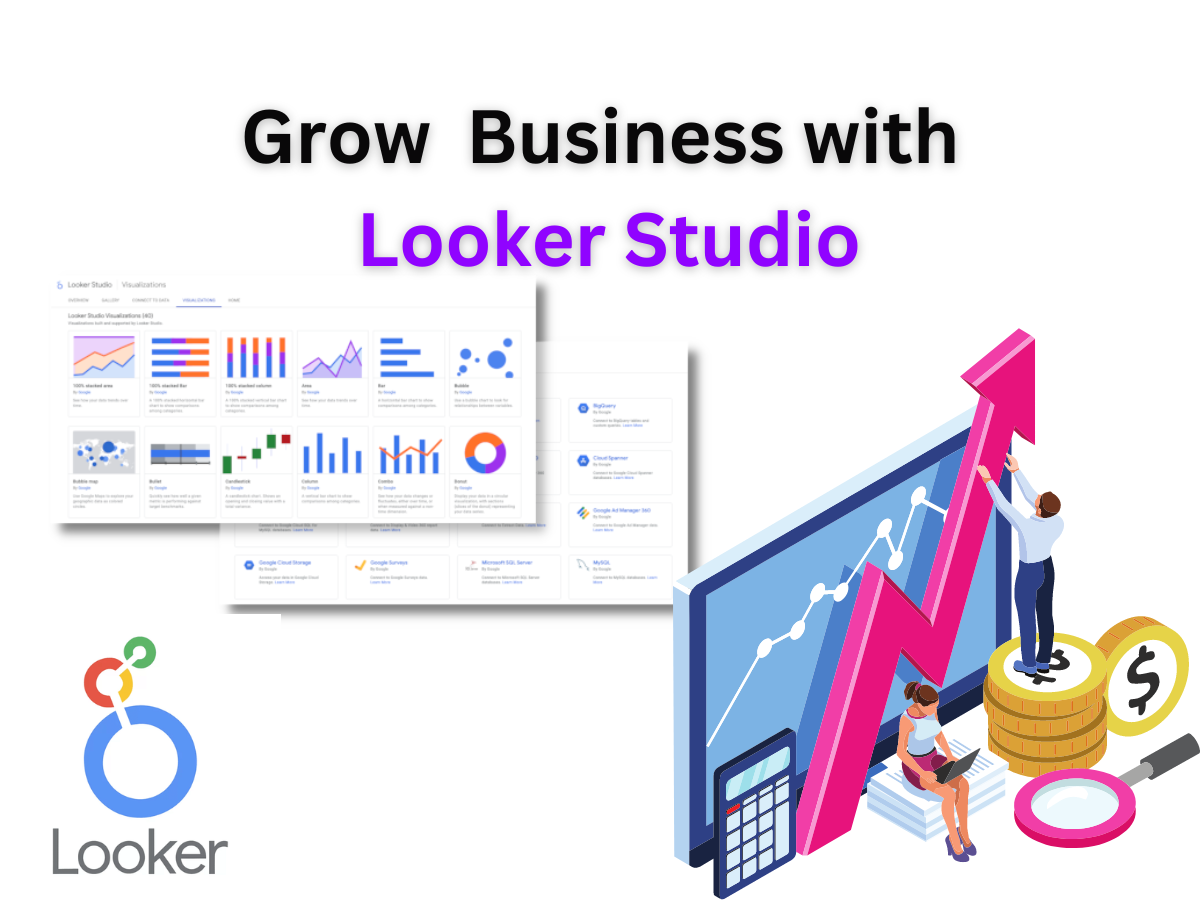
You have different types of data, and you want to see these data in different chart or table forms so that you can easily understand the position of your business. Just like that, Google Looker Studio lets you create a dashboard for your business data. Looker Studio offers to connect several data sources. It’s a really amazing tool for visualization. Looker Studio offers popular platform data to create dashboards like Google Sheets, Google Analytics, Meta ads, BigQuery, and Salesforce, without needing to write any code. Looker Studio is a great tool for anyone who wants to get started with data visualization or who needs to create reports and dashboards for their business.

Now that we know enough about Looker Studio, what is Looker Studio? And how does it work? Now let’s know how this Looker Studio can help us in business.

You can get new opportunities

When a business is operating in the market, that business generates different types of customers every day. And some customers walk away even after approaching the product. It may also have some problems. So if you don’t analyze these data very well, then you are missing out on many opportunities. When you realize that your customer is walking away from your product, you will make a different decision.

This is where Looker Studio helps you display your business journey in charts and graphs. This means you can make new business decisions that can change your business journey.

Target the Right Audience

But you try to bring customers from different places for your business. It may be a website, it may be Facebook, it may be Linkedin. So you are bringing customers to your business from different sources. Simply speaking, Looker Studio will help you very well to reach our targeted customers.

How to help business startup

According to me, two things are very important to check for a business startup. In starting a business, two things can be thought of: solving a problem and value creation.

Solving a Problem: But when you go to solve a problem and build a business on that thing, you must analyze what is actually going on in the market. You can take the data from different places, but when you take the data, you will get the data in raw format. If you want to see those data, then Looker Studio will help you very well.

Value Creation: A startup needs to create value for its target audience. Startups often rely on assumptions about their target market. Looker Studio can ingest data from various sources, including customer surveys, website analytics, and social media engagement. And when you analyze these data, you can give a very good value.

Data-Driven Product Development

Since the whole world is running after data now, your business data will help you to run a good business. You probably know that if product development sectors are connected to data, they can develop products according to customer needs. For that, you need to analyze customer behavior and do product development.

Let me speak from my practical experience. A few days ago, I created a business dashboard. They sold wooden brushes and pens. They were happy with their product. However, when I analyzed their data, I realized that if they combine these two products or develop separate products for children and adults, they have a chance to do better in the market. And then they did that and could take their business to a better level within a few days. That’s why I would say Looker Studio will help you a lot in terms of product development.

Grow Your Business with Looker Studio

After all, you now know a lot about how Looker Studio can take a business to the next level. It can be said without a doubt that Looker Studio will help you to create an advanced dashboard. And from where you can get your required solution.

We create Looker Studio dashboards for different businesses different data sources. If you don’t have enough time to create a dashboard, you can contact us.

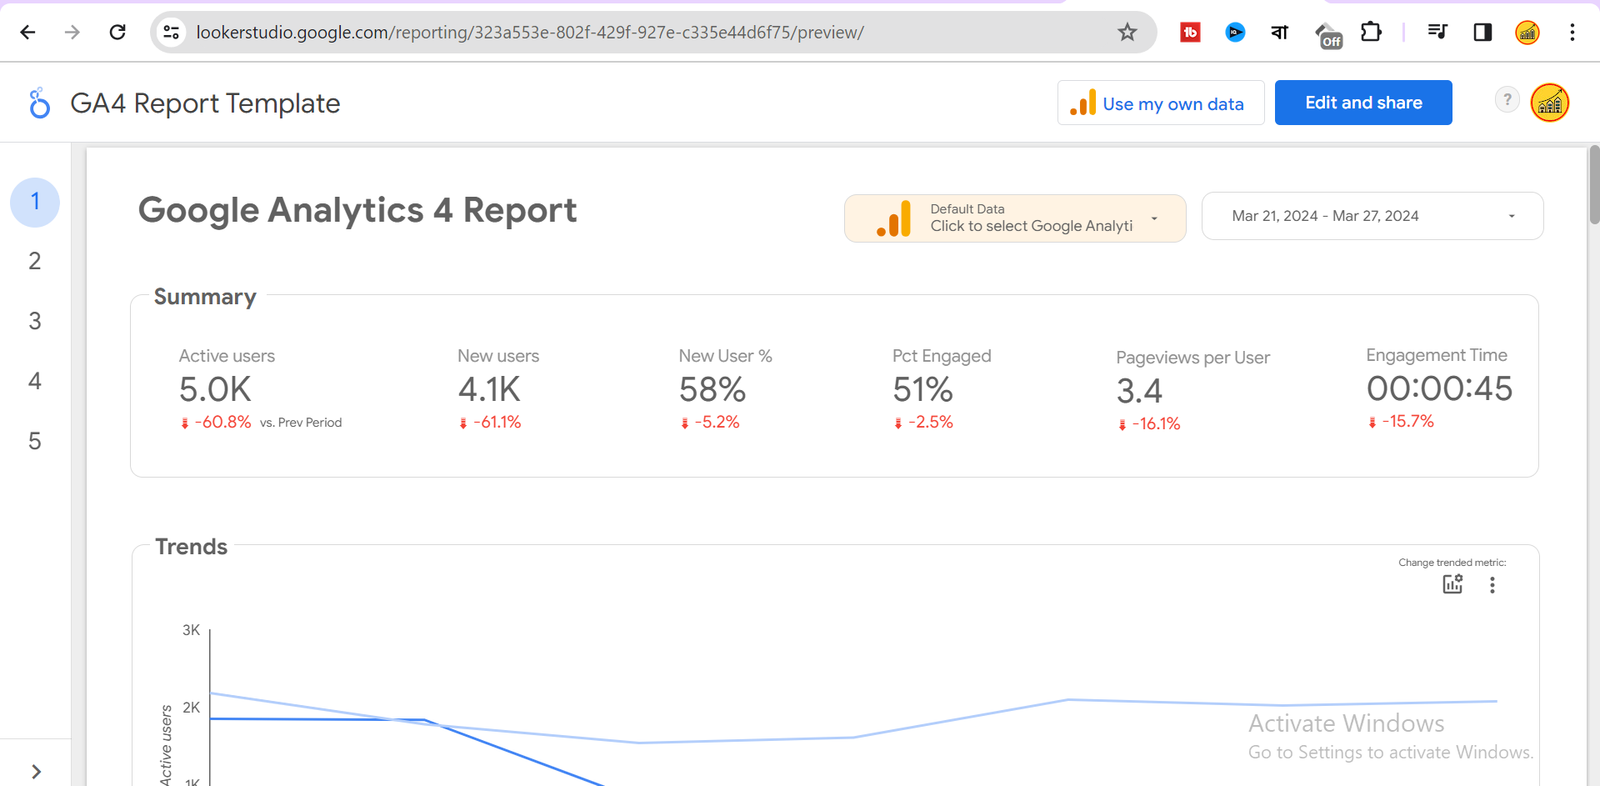
Looker Studio is the best tool for Google Analytics 4 (GA4) data analysis.

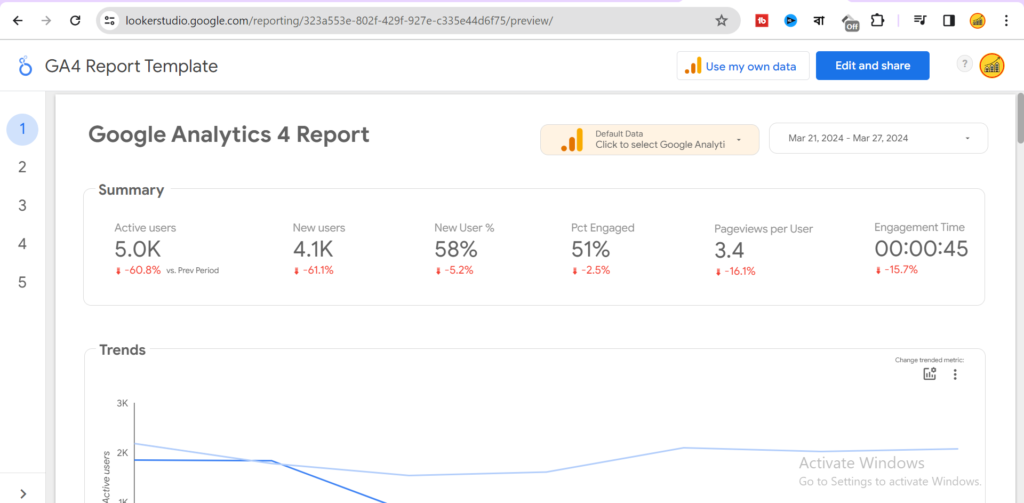
In my last two projects, I have been working on Digital Marketing Data for my client’s friend. So, my client’s friend is my second client. He has an online business that relies on Google. Therefore, he has created a website and apps to run the business perfectly. He has been running this business for the past three years. Last year, I worked on some SEO tasks for him. Now, he requires some analytical results, which is why he reached out to me. As a Data Analyst, I have examined all the business strategies, including website and app traffic using the Ga4 dashboard. Ga4 is the latest Google Analytics tool designed to help measure and analyze website and app data, offered for free by Google.

In July 2023, Google introduced GA4 to replace GA3. GA4 is three times better than GA3 because it offers AI and Machine Learning capabilities. For example, I integrated a Google Ads account for my client to understand user search behavior, thus improving ad ROI. While Ga4 provides essential analytics, its dashboard is not optimal. On the other hand, Google offers Looker Studio, which is the best data visualization tool. Looker Studio is free, and I have created a Looker Studio dashboard using Ga4 data.

In this article, I will share my journey and explain why I use Google Looker Studio for creating Ga4 data analysis dashboards.

Why Looker Studio is the First Choice for Ga4 Data Analysis

There are several reasons why Looker Studio (formerly Data Studio) might be considered the top choice for GA4 data analysis. Both GA4 and Google Looker Studio are Google products, ensuring a smooth connection. When I first encountered my client’s data, I considered GA4’s data structure, including event-based measurement and user-centric metrics. Looker Studio’s dashboard facilitated my understanding of this data.

As a data analyst, I recognize that dashboards are crucial for presenting business insights. Business owners rely on data to make informed decisions, and Looker Studio provides the tools to achieve this. While Ga4 data can be intricate, Looker Studio offers a wide range of visualization options such as charts, graphs, and maps, transforming complex data into actionable insights.

Why Looker Studio Excels with GA4 Data

Data analysis involves extracting insights from data to make better decisions. Looker Studio excels in this regard, providing easy data integration for GA4 due to its status as a Google product. It offers advanced visualization tools, a user-friendly interface, and real-time insights, crucial for fast-paced decision-making.

How to Connect and Create a Looker Studio Dashboard Using GA4 Data

Connecting GA4 data with Looker Studio is straightforward. Ensure you have access to both Google Analytics and Data Studio. Follow these steps:

  1. Open Data Studio: Visit https://lookerstudio.google.com/ and sign in with your Google account.

2. Create a New Report: Click the “+” icon and select “Blank Report.”

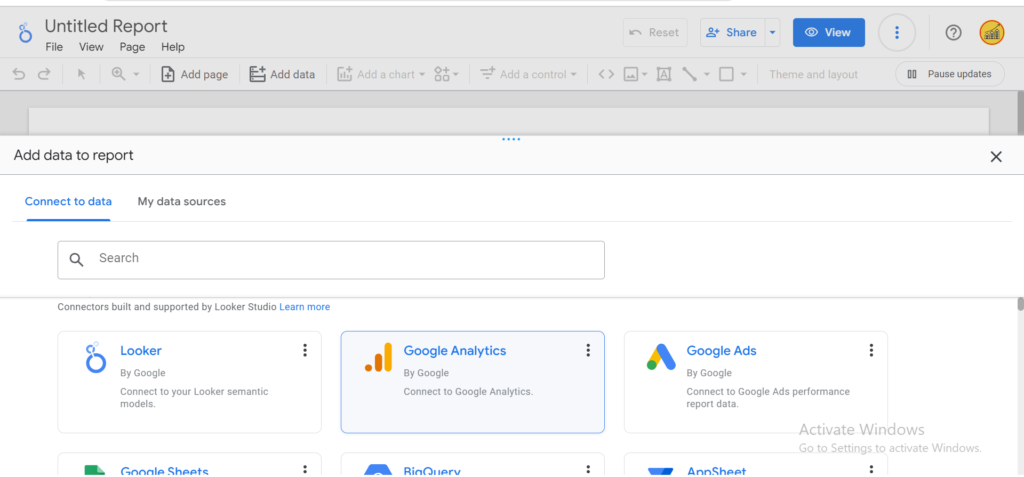
3. Add Data Source: Click on “Add data” in the top left corner.

4. Choose Google Analytics Connector: Select “Google Analytics” from the data source options.

5. Connect to GA4 Property: Choose the desired Google Account and select the GA4 property.

6. Connect and Explore (Optional): Click “Connect.” You can modify or create new data schemas if necessary.

7. Create Report: Click “Create report” in the top right corner.

By following these steps, you can create a dashboard for Google Analytics. The challenge lies in organizing the data charts to provide meaningful insights for business decision-making.

If you lack the time to create such a dashboard, feel free to contact us directly. Our experts will assist you in building your dashboard.

Why Startups Need Data Analysts

Now it is easy to say that I am going to start a business, but it is very difficult to know exactly what I need to do for this startup. Last year, my friend thought of starting an online business. He knows about business because he comes from a business family and he earned a degree. So he thinks that I know about business and I have the last 3 years of experience with this product, so it will be very easy for me.

My friend made a team of 5 members and started the business. Undoubtedly, his products were very good. They also have a good name in the area where his father used to sell these products. But her business. But his products were not selling well.

Then one day my friend asked me about a good startup, I told him that nowadays any startup needs to do data analysis. Because you know that now the whole world depends on data. Every field and business creates data. When you think about any business then you know about business insight. For this, you need proper data analysis.

In this article, we gain some practical experience about why startups need data analysis.

4 Key Reasons Why Data Analytics is Important for Startups

You know every business creates enough data. So we can make an easy business plan with data basis. But it’s difficult if you don’t know about proper data. Data helps you to know about target markets, decision-making, marketing, and targeted customers.

For example, in my friend’s case, after doing data analysis, his business became superfast. And I did the data analysis of my friend’s entire business. And I will tell you what I did for this.

Through data analysis, you can do Business decision-making very easily.

Data analysis is the first choice for business decision-making. When you think of setting up a business in the market, your every decision needs to be perfect. And in the current context, data analysis is required to take a good decision. In the beginning of this paragraph, I gave an example about my friend’s business, the friend started the business traditionally. But could not take a very good decision. This is because he did not know about data and did not do market data analysis. So, data analysis is a game-changer for Startup decision-making.

Through data analysis, you can find Target markets.

Finding the target market is very important in business. Suppose you want to sell a motorcycle lock, then what would be your target market? If you are targeting a city for marketing, there may be a variety of people in that city, including people who don’t own motorbikes, your marketing campaign may include. It will only cost you more and nothing else. And this is where a data analyst will help you shortlist the motorbike owners in the city.

Through data analysis, you can make marketing campaigns.

Since you know at this stage who your target audience or customers are, you can tailor the campaign based on them. For example, let’s say you sell motorbike locks to people who ride motorbikes as your target audience.

Now we discuss about Data analysis is a fundamental part of creating effective marketing campaigns. Like:

Understanding audience: which is our main audience we can find By analyzing customer data and demographics.

Crafting compelling content: Every campaign needs good content. Data can show you what kind of content resonates with your audience.

In short, data analysis helps you move beyond guesswork and create marketing campaigns that allow you to make a good startup.

Conclusion

In today’s information technology era, no business can do well without data and if we look at startups then data analytics can take a startup to the next level. I gave you a practical example of my friend’s business, how he made his business superfast by doing data analysis. There are many levels of data analysis, if you know some of the levels, then you can analyze any data very easily. As I used to analyze my friend’s data. Stay with us to know something new and visit our blogs daily.