Can I should know programming for data analysis?

I remember when I was starting to learn about Data Analysis then I didn’t know about programming. Firstly, I am starting my online career in Digital Marketing. Then I switch to Data Analyst. So that time I analyze different types of Digital marketing data. And you know Digital marketing data is not big data. So I use Excel. Please pay attention to its an important point, when you work for a small data set then Excel is the first choice for every data analyst.

Like, if you have office employee data then you easily go to Excel, and you have Google analytics data analyzed then you go to Google Looker Studio.

Now you understand when you work for small data for that you don’t need to learn programming. But when I use programming for data analyst let’s find out.

How To Become A Data Analyst Without Programming?

If you want, you don’t know coding and you go to for data analysis it’s possible. You know Excel is the most commonly used for every business world. and now Excel is used for data analysis widely. and when you master Excel then you are playing with data. Excel is a powerful tool for data manipulation, analysis, and visualization. When you know these things perfectly then Excel will give you a strong foundation in data analysis.

But it’s for small amounts of data not for big data analysis data. Like you have office staff data then Excel will help you. Or you have 1000 of row data then Excel will help you for data analysis. But when you have to analyze big data then Programming is the first choice.

How To Become A Data Analyst With Programming?

You know programming makes any work easier. In my case when I start my data analyst journey I work for the small data set. But when I started to play with large data sets then I needed to learn Programming. I remember that I was working on a govt project at that time I didn’t know properly Programming. Because that government data set is very big. Then I learn about programming. I learn Python for data analysis. I think Python is an easy programming language.

If you are ready to work for a big data set then Programming is your first choice. And you can learn easily and two or three months you can expert on coding for data analysis.

Pros of Programming for Data Analysts

When I learn programming for data analysis then I unlock powerful tools for statistical analysis, machine learning, and data visualization. It sounds good because when I play data with coding then data analysis is more interesting for me.

I think when you are thinking about programming then you earn Advanced Analytics skills. But you need to Choose the Right Language. At this time popular data analysis programming languages like Python, SQL, and R. In my case, Firstly I learn Python. You can learn which is authentic for you.

Real-world work which is the best?

In the real world for data analyst programming is help you with advanced data analysis. I mostly like to share my own practical expressions in my articles. When I was only doing data analyst tasks with Excel and Power BI I was missing out on a lot of opportunities. Many projects would have passed away from me, but when I learned programming, I spent less time doing data analysis and got more opportunities so people could trust me.

So my advice will always be if you are a new data analyst then start working without programming and if you have been working with this data analysis for more than six months then you should learn programming and use programming to do data analysis.

Which is the best programming language for data analysis?

Well, you naturally think that which programming language is being used more for data analysis. Because when you look around you will see that simple programming languages are always used more. Data analysis programming languages like Python, SQL, and R. Those language help you find data insight. But as a beginner, you can learn Python for data analysis.

You can learn Python easily and we will discuss in the next article about what other opportunities you will get if you learn Python.

Conclusion

After all, today we learned that if you are an advanced data analyst, you need to know programming. But if you are at the beginner stage then you should learn how to easily analyze data with Excel and Power BI to get data insights.


Best Visualization Tools for Digital Data

For the last six months, I have been working for my client who runs an e-commerce business selling pillows in the American market. During this time, we have implemented various marketing funnels and strategies, including Google ads, Meta ads, and SEO, to attract customers.

These three marketing channels generate different sets of data, resulting in monthly sales ranging from $5000 to $7000, meeting our targets most of the time. However, in the fourth month, our sales declined, prompting us to analyze the situation. We turned to data analysis to identify the issues. Our primary customer sources are Google ads, Meta ads, and our website. Although each platform offers a dashboard for understanding customer behavior, I encountered some challenges when using them individually. Therefore, I utilized Google Looker Studio for data analysis and visualization, gaining valuable insights that helped us devise new plans and increase sales in the fifth month.

In this article, I will share our journey and introduce one of the best visualization tools for digital data: Google Looker Studio.

Google Looker Studio

Originally named Google Data Studio, Looker Studio is a web-based tool designed to transform data into informative dashboards and reports. It offers features such as data visualization, data connectivity, customization, sharing, and collaboration.

Google provides Looker Studio free of charge, making it an ideal choice for our digital data analysis needs.

Now, let’s delve into our journey of creating Looker Studio dashboards. I developed three distinct dashboards for our three data sources.

Looker Studio Google Ads Dashboard

Looker Studio provides robust analysis and visualization of Google Ads data. Initially, I connected our data to Looker Studio using its built-in Google Ads connector. Additionally, Looker Studio offers pre-built templates for Google Ads.

If you choose to use the Google Ads template, you can create your dashboard with a single click. However, in our case, I opted to create a custom dashboard tailored to our business needs. I selected specific metrics and dimensions, such as clicks, impressions, conversions, and costs, and designed eight charts and graphs, including bar charts, line charts, pie charts, and maps.

Looker Studio Meta Ads Dashboard

While Meta offers its own ads dashboard showing metrics like customer conversion rates, impressions, and CTR, Looker Studio becomes invaluable when you need more comprehensive analysis. After connecting our Meta ads data to Looker Studio, I designed a dashboard that provided deeper insights into Meta ads performance. If you have Meta ads data and need advanced analysis, Looker Studio is the ideal tool.

Looker Studio Google Analytics 4 (GA4) Dashboard

With our website’s SEO in place, we started receiving traffic from Google searches, leading to Google Analytics data. To analyze this data, I connected Google Analytics to Looker Studio and selected GA4 metrics and dimensions relevant to our needs. Creating the dashboard in Looker Studio was straightforward, thanks to its drag-and-drop interface.

Overall, my experience as a professional data analyst using Looker Studio has been excellent. I highly recommend it for digital data analysis and visualization. If you require assistance with your data analysis, feel free to reach out to me.

Thank you for your time.

What are the best tools for Data Analytics?

In today’s data-driven world, data is more important than ever. Every business needs data analysis to understand their business insights. If you’re reading this article, it means you want to know what the best tools for data analytics are. In today’s era of AI, you can solve almost any problem with AI. In this article, we’ll explore the best tools for data analytics.

When I work with business data, I always try to use the latest tools. In my last project, I used Python or Power BI.

So as a professional data analyst, you need to learn some data analytics tools.

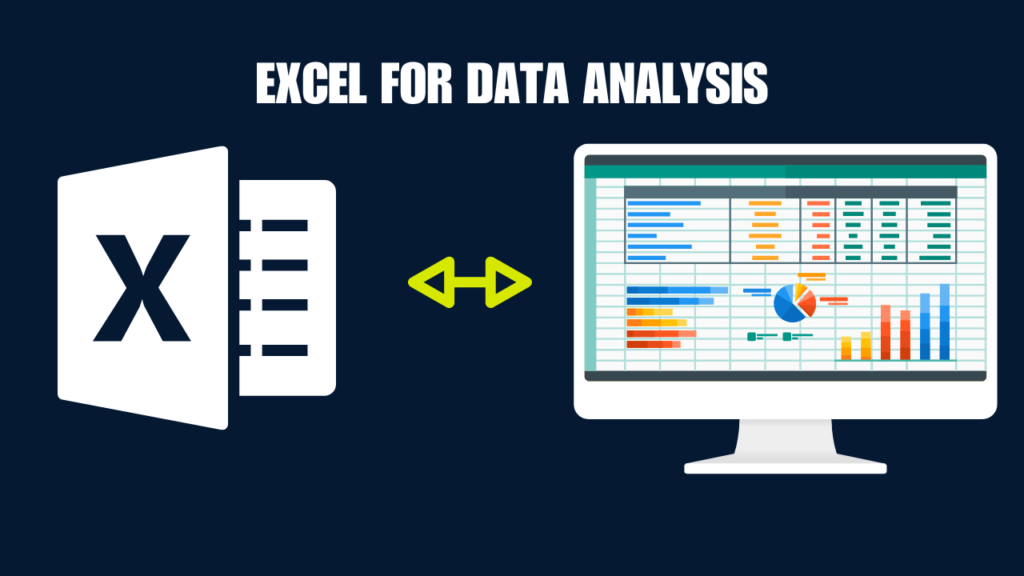
Excel

Can you name a business task that cannot be done in Excel? I’ve been working with Excel for the last 5 years. I use Excel every day in my data analyst career. Therefore, Excel is essential for every type of business, especially for data analysis. When you have analytical Excel skills, you can analyze business data quickly. Excel also has some AI features that help you solve data problems.

Data cleaning is crucial. If you have thousands of rows of data, you can clean it all in Excel. With simple functions, you can gain insights and analyze data. You can even create data dashboards. I use Excel every day in my data analyst career. Therefore, Excel is the best tool for data analytics.

Power BI

You’re familiar with Power BI. Power BI is the best tool for data visualization. It’s a useful business intelligence tool. If you have Python knowledge, you can use Python code in Power BI to simplify your work.

When you create a data dashboard in Power BI, it helps you create different types of dashboards easily. Data visualization is crucial for a data analyst. Therefore, I believe you should learn Power BI to become a good analyst.

Python

You might have heard that programming is not necessary for data analysis. I support that thought. However, as a professional data analyst, programming helps you work faster and easier. Python is an easy-to-understand programming language that has become an essential tool for data analysts.

Python offers features for data analysts such as data manipulation, statistical analysis, data visualization, and automation. When I use Python for my projects, it significantly speeds up my work. However, it may be a bit difficult to learn at first.

A task that takes 1 hour with Excel can be done in 20 minutes with Python. Therefore, to become a good data analyst, you should learn Python programming.

Jupyter Notebook

When you think about programming for advanced data analysis, Jupyter Notebook is the best tool for you. It helps you with live coding, equations, and live data visualization. It’s free to use and open-source. It supports multiple programming languages like Python, SQL, and R.

Key functionalities of Jupyter Notebook for data analysis include interactive coding, data visualization, and documentation.

SQL

As a professional data analyst, I use both Excel and SQL together. If you want to excel as a data analyst, you should learn SQL skills. SQL is a query language. It’s the primary choice when working with big data. Therefore, you should learn SQL to become a good data analyst.

Google Looker Studio

You’re familiar with digital data. Digital data includes Google Analytics, Google Ads, or any type of ads data, which you can visualize using Google Looker Studio. It’s a business intelligence tool like Power BI. However, Looker Studio offers easily data visualization.

It’s a free data visualization tool and web-based. Last month, I created 12 dashboards using Looker Studio. You can learn Looker Studio for digital data analysis.

Which tools do you know perfectly? You can tell us in the comments. Thank you.

How can I become a good data analyst?

A few days ago, my friend told me about their motorcycle store company. They are thinking about data, and my friend mentioned they have five years of sales data. They believe their data needs to be analyzed to make better offers for their regular customers.

Last month, my friend’s company launched a new product and sold it to their established customers, resulting in a 10% increase in revenue for that month. You believe this is possible only through data analysis, highlighting the growing importance of data for every business. Today, every business has raw data, but this data can be a great opportunity if analyzed correctly.

As you know, data is a valuable asset for every business. So, if you’re considering a career focused on data, you’re making a smart choice. In this technological age, data analytics is a great career option.

I believe you might be interested in pursuing a career as a data analyst. Based on my practical experience, I’ll share some tips on how to become a good one. While some rules are fixed, other valuable tools can help you excel in this field.

Understand data patterns.

As a good data analyst, you should be able to understand data patterns. This requires specific domain knowledge. When you understand the data patterns of an industry, you need to have expertise in that industry. For example, if you know everything about the medical industry, you have domain knowledge in that field. My domain knowledge lies in digital data. Understanding data patterns can help answer various questions and achieve different goals.

Understand the analytical game.

A few months ago, I analyzed a company’s data. I excelled at extracting insights from their data, and based on my findings, the company launched a marketing campaign. However, the campaign ultimately failed, resulting in a loss. I then re-analyzed their data and discovered they had many competitors and their product was more expensive. I shared this entire analysis with them. This highlights the importance of understanding the “analytical game” as a good data analyst.

Know the basic math.

Basic math helps you quickly understand data patterns. When you see clean data, you might think about how you can work with it. I always start calculating whenever I see a dataset because it helps me understand data patterns.

I believe you’re familiar with basic math operations like addition, subtraction, multiplication, and division. These basic math concepts help you work with various shapes, patterns, and fractions.

Many analysts ignore this, but these skills are important for good data analysis.

Tell a good data story.

“You’re never going to kill storytelling, because it’s built in the human plan. We come with it.” – Margaret Atwood.

This concept is truly helpful for your data analysis career. If you tell a good story using your data, you can gain better insights from it. During my last data analyst project, I designed two different dashboards and created two stories based on the data. I believe these stories were helpful for the business.

Therefore, knowing how to tell a good data story is essential for being a good data analyst.

Work with real data.

Every beginner starts learning data analysis with dummy data. However, all experts recommend working with real data to gain real-world experience and improve your learning. You can practice with real data and create small data analysis projects to gain valuable insights. As I began teaching some students about data analysis, I started them with real data like Google Ads data and Facebook Ads data. They easily understood this data, and I believe this process is quite beneficial for learners.

Therefore, working with real data is essential for becoming a good data analyst.

Practice and Exercise

I remember when I was new in this data field, I practiced a lot. Because I knew that practice is more important to understanding data concepts. I think data can be messy. When you can work with it repeatedly, then you understand the whole nature of data.

Practice, practice, practice is more important to be a good data analyst. When you work with different types of data, it leads to a great understanding.

I think these steps will make a good data analyst. At this stage, what data stage are you in? Tell me something in the comments.

How to become a successful Data Scientist from a non-technical background.

Today’s world data is most powerful. Every tech company analyzes its data and makes good decisions. Nowadays, everyone knows that data is an important asset, and Data Science and Data Analysis are good career choices. However, two years ago, I didn’t understand what data was. During that time, I had no questions about what Data Science or Data Analysis were. One day, I received a job offer from the Army Force for a computer operator position. During that period, I learned the basic operations of computers, such as MS Office Word, Excel, PowerPoint, etc., and I joined the Army Force as a computer operator.

There, I worked on data entry. Some data were their own, but most of the data I researched online and entered. I used Excel for data entry, and during this time, I gained basic to advanced Excel knowledge. You might be thinking that at that time, I was just starting to work with data and learning about Data Science and Data Analysis.

Later, I learned Data Science. After eight months, I learned the basics of Data Science and implemented my data work. I am not a technical background student, but now I am a Data Scientist. Three months ago, I joined a new job as a Data Analyst in a tech company.

If you have enough time to learn how to get into Data Science from a non-technical background, keep reading. Because I will share with you step by step my learning technique.

How to Convert Your Career From a Non-Technical Background to Data Science.

I assume you know the basics of Data Science, like what Data Science is, because when I enter social media, I see that everyone is talking about Data Science. So, I will share with you my total journey of how I cracked Data Science with a non-technical background.

First, Learn Excel for Data Analysis.

You know Excel is a useful tool for every type of business. If you are a student or a fresher, I think you know about Excel. When I was working for the Army Force, I used Excel. Firstly, I entered their data in Excel. Then, I worked with large datasets that I collected from different types of organizations. I used Excel to clean that data.

Sometimes I created dashboards in Excel, like which department is very popular, which condition is not good. I remember one day the boss came to me and asked me to make a graph of all the members of his department who had taken the most vacations in the last five years. Truly, it was a very hard task for me at that time. Then I learned about it, and I made an Excel Dashboard.

Now I am sharing with you how you can make the same Excel Dashboard. It’s very simple:

Create the graph:

  • Select the data you want to visualize (employee names and total vacation days).
  • Go to the “Insert” tab and choose your preferred chart type. A bar chart or column chart is suitable for this scenario.
  • Customize the chart by adding titles, labels, and formatting as needed.

I think if you create a graph showing this document, you will know about Excel. Or if you can’t create a graph, then you need to learn Excel.

In my case, Excel helped me understand how to work with real data. I think you can play with different types of data. Let’s move on to the next step.

I Learned Power BI.

Truly speaking, if you have good knowledge about Excel, then Power BI is much easier. When I realized I had control in Excel, I learned about Power BI. Power BI is a Business Analytics tool. If you are an Excel expert, you can analyze or visualize all types of data. But Power BI has advanced features that offer great data insights.

I think if you know the fundamentals of Excel, like how to make a dataset, data cleaning, and using Excel PivotTables, charts, filter, functions, then you can learn Power BI in a short time. I repeat, once you start playing with data, and if your Excel knowledge is good, then you will learn Power BI very easily.

For Advanced Work, Learn Python.

Many people think that there is no need for programming to become a data analyst. But I think Python helps you for advanced tasks. I can easily explain it to you. You know, data science means you are able to work super fast. Like you have 10,000 data rows and you need insights for all data in one click. If you can do this, then you are undoubtedly a good data analyst. When you do this task in Excel, you may need to write different types of functions. But when you can do the same thing in Python, you only write a single code.

Python is a very easy programming language. You can learn it in a short time. I learned Python for data analysis in only 45 days. So you need a challenge to learn Python.

One thing is more helpful for learning the first programming language. At first, I was figuring out the rationale for learning programming. That’s why I’m learning Python because this time I have enough knowledge in Excel and Power BI.

I started doing the same things with Python that I used to create functions or rules in Excel. Truly, this method is very helpful for learning Python for Data Analysis. You can apply the same things for learning Python for Data Analysis.

Then I Learned SQL.

I think you know why we use Excel. Using Excel, you can create a dataset. When you think about data, Excel is basic spreadsheet software. When dealing with massive datasets, you need to use SQL. Last month, I was working on SQL. I realized that for datasets similar to pivot tables in Excel, SQL excels at performing aggregations like calculating sums, counts, minimums, and maximums, but on a much larger scale and across multiple tables simultaneously.

I have more to learn in SQL. I am working with new datasets, and I think I will become a professional in SQL in a few days.

Learn Statistics.

I have heard from many people that to be a good data analyst, one should be very good at statistics. I was not very good at statistics in my academic studies. And that’s why I was scared after choosing a Data Analyst career. But I think, and with real work experience, if you have experience in High School math, then you can calculate every type of data.

Data doesn’t mean all work on statistics. Statistics help you understand the data game. I think it’s simple things for you.

Gaining Practical Experience.

This stage is really very important, my friend. Practical experience helps you understand and solve data problems. Because at the end of the day, all data scientists work to get good insights into data. I think you understand what your next step for data is.

Start working with as much real data as you can. If you are really interested in data, then I will advise you to read my next article on how to gain practical experience.

That’s it for today, but don’t forget to let me know what you think about the data now. Thanks.