Which Freelancing Platform is Best for Data Analyst Work?

Freelancing as a data analyst offers the freedom to work from anywhere, choose projects that align with your passions, and set your own schedule. But how do you break into the freelance world, especially as a beginner with little to no experience? This article will walk you through a step-by-step process to kickstart your freelance career, whether you’re starting fresh or transitioning from a traditional job. By the end, you’ll know how to gain experience, market yourself, and land that all-important first job.

Step 1: Gain Experience Before Freelancing

The first and most crucial step in becoming a freelance data analyst is gaining experience. It’s tough to get hired as a freelancer without a track record, as companies expect freelancers to provide value immediately. Unlike full-time employees who grow into their roles, freelancers are hired for their expertise. So, how do you gain experience?

The traditional route is to take a regular job first. Working as an employee provides valuable hands-on experience in real-world environments that online courses or books can’t replicate. While it may seem like freelancing is delayed, this experience will allow you to build the skills necessary to offer real value as a freelancer later on. You’ll also build a professional portfolio and gain insight into the business side of data analysis, preparing you to work independently.

Step 2: Skip the Traditional Route – Start Freelancing Online

If you’re eager to jump straight into freelancing, there’s another, faster path: the online freelance market. Websites like Upwork, Freelancer, and Fiverr connect companies with freelancers from around the world. While the competition is fierce, you don’t need years of experience or certifications to start. All you need is an online profile and a service to offer.

One downside to these platforms is that you’ll be competing against freelancers from regions with lower living costs, who can charge much less. This may make it difficult to stand out, but there are two key strategies you can use to overcome this.

Step 3: Stand Out With Competitive Pricing and Specialization

When starting out on freelance platforms, gaining reviews is crucial. One way to attract clients is by offering your services at a lower rate initially. While you may not earn much money in the beginning, you’ll be working to gather reviews and testimonials, which will make it easier to charge higher rates later.

Another way to stand out is by specializing in a niche. Instead of marketing yourself as just another “data analyst,” focus on a specific skill set. For example, offer to build dashboards for YouTube analytics or provide data insights tailored to content creators. Specializing not only reduces competition but also makes you more attractive to potential clients looking for specific solutions.

After Learning these steps we will join Freelance Platfrom

Which Freelancing Platform is Best for Data Analyst Work?

Upwork: A Global Freelancing Marketplace

Upwork is one of the largest freelancing platforms and a popular choice for data analysts. It connects freelancers with businesses from all over the world, offering a wide variety of projects in data analysis, from data cleaning to complex machine learning models.

Fiverr: Quick Gigs for Data Analysts

Fiverr is known for its gig-based approach to freelancing. You set up your services (gigs), and clients choose you based on what you offer. For data analysts, this could range from building dashboards to running specific data queries.

LinkedIn: The Professional Network

LinkedIn is not traditionally a freelancing platform, but it has become an essential tool for freelancers, especially data analysts. With its vast network of professionals, LinkedIn allows you to connect directly with potential clients or find freelance gigs posted on the platform.

Keep Learning and Growing

Freelancers need to constantly update their skills, especially in fast-evolving fields like data analysis and IT. As an employee, your company might invest in your growth through workshops, courses, or certifications. As a freelancer, this responsibility falls on you. Stagnating in your skillset can lead to fewer job opportunities as the market evolves.

Final Thought

Remember, freelancing is a journey. It requires persistence, constant learning, and a willingness to take the leap. If you’re ready to work for it, freelancing can offer unparalleled freedom and career satisfaction. Take the plunge and start building the freelance career you’ve always dreamed of today!

How I Made $50,000 in 6 Months as a Freelance Data Engineer: A Step-by-Step Guide

Freelancing has become a popular way to achieve financial independence while enjoying the flexibility of working from anywhere in the world. I embarked on my freelancing journey after quitting a high-paying job, and within six months, I was able to earn $50,000 as a freelance data engineer. However, this success didn’t come overnight. My journey was filled with challenges and learning experiences, which I’m sharing here to help you start your freelancing career without making the same mistakes I did.

Why I Chose Freelancing

Like many people, I was tired of spending 2 to 3 hours commuting to a job I didn’t enjoy. I longed for the freedom to work from anywhere, on my own terms. That’s when I discovered freelancing. But let me be honest—my freelancing journey was not straightforward. I failed many times before figuring out what worked. This guide compiles everything I’ve learned to help you avoid the pitfalls and start your freelancing career successfully.

Understanding Freelancing

At its core, freelancing is about solving a client’s problem in exchange for money. Clients prefer freelancers because they provide flexible, skill-based solutions without the overhead of hiring full-time employees. As a freelancer, your job is to find clients with problems you can solve and get paid for it. But there’s a key element to this equation—you need to have the right skills.

Step 1: Acquiring High-Paying Skills

The first and most important step in freelancing is acquiring skills that are in demand. For me, data engineering and web scraping were my starting points. But your skillset doesn’t have to be something you’re passionate about; it just needs to be something you can deliver. Whether it’s data science, machine learning, video editing, or graphic design, focus on a skill that pays well and that you can execute confidently. Remember, the goal of freelancing is to make money, not necessarily to love what you’re doing from the start.

Step 2: Build a Portfolio

No matter how skilled you are, no one will hire you if you don’t have a way to showcase your work. That’s where a portfolio comes in. Even if you’re a complete beginner, you need to create a few sample projects to demonstrate your abilities. In my case, I had experience from internships and previous jobs, which I used to build my portfolio. If you don’t have any work experience, create projects on your own to show potential clients what you can do.

For example, if you want to be a freelance data analyst, you should create two or three dashboards that demonstrate your capabilities. Having a portfolio not only gives you credibility but also makes you stand out among other freelancers competing for the same clients.

Step 3: Start on Freelancing Platforms

Once you have a portfolio, it’s time to start looking for clients. Freelancing platforms like Upwork and Fiverr are great places to begin. These platforms are filled with clients looking for freelancers to help with various tasks, but the competition is tough. Just creating a profile won’t be enough. You need to optimize your profile by using the right keywords, showcasing your best work, and having a professional image.

I started my freelancing career on Upwork, and while it took time to get my first job, it was worth the effort. To build a good profile, I recommend researching other freelancers in your niche and modeling your profile after theirs. This helps you understand what works in your industry and makes it easier to stand out.

Step 4: Specialize in a Niche

Being a generalist in freelancing won’t get you far. Clients often look for specialists who can solve specific problems. In my case, I wasn’t just a general data engineer; I specialized in AWS, GCP, Airflow, and building dashboards with QuickSight. Specializing in a niche area gives you an edge over other freelancers and makes you more appealing to clients looking for that specific skill.

For example, if you’re a data analyst, you might choose to specialize in tools like Power BI or Tableau. This way, when a client needs someone with expertise in these tools, you’ll stand out as a top candidate.

Step 5: Craft Personalized Proposals

Once your profile is set, the real challenge begins: applying for jobs. Clients post their problems on platforms like Upwork or Fiverr, and freelancers submit proposals offering solutions. This is where most freelancers fail. They submit generic proposals, expecting clients to respond. In reality, clients receive hundreds of proposals, and a generic one will almost always be ignored.

In my early days, I submitted over 100 proposals without landing a single job because I was using templates. What eventually worked for me was personalizing every proposal and focusing on the client’s problem. Instead of talking about myself, I started my proposals by offering a solution to the client’s problem. This approach builds trust and shows that you understand their needs.

In today’s world of AI tools like ChatGPT, it’s easy to generate a proposal in seconds. However, clients can tell when something is impersonal or generic. Make sure your proposals are tailored to each client, showing genuine interest and expertise in solving their problem.

Step 6: Be Persistent and Keep Improving

Freelancing isn’t a get-rich-quick scheme. It requires hard work, patience, and persistence. Even after submitting well-crafted proposals, it may take time before you land your first client. In my case, it took over 100 proposals to get my first gig. But once you break through, things get easier. After landing my first client, I was able to build lasting relationships that led to consistent work.

If your proposals don’t get responses, don’t get discouraged. Keep refining your profile, learning new skills, and applying for more jobs. Each rejection is an opportunity to learn and improve. Stay persistent, and you’ll eventually get a reply.

Step 7: Master the Art of Selling Yourself

When you finally get a reply from a client, the next step is to sell yourself. This doesn’t mean you need to be pushy, but you do need to convince the client that you are the best freelancer for the job. Get on a call, explain your skills, and communicate why you’re the perfect fit for their project. Good communication is essential, but you don’t need to be a master speaker. You just need to clearly convey how you can solve the client’s problem.

Remember, freelancing is not just about doing the work; it’s about running a business of one. You’re responsible for every aspect, from acquiring clients to delivering the final product. Keep learning, refining your skills, and improving your business strategy.

Conclusion

Freelancing offers immense potential for those who are willing to put in the work. It’s not an easy journey, and it takes time to build a reputation, but once you do, the rewards can be life-changing. In my first six months as a freelance data engineer, I was able to earn $50,000, but this was only possible because I took the time to learn the game, acquire the right skills, and persist through the challenges.

If you’re ready to start your freelancing journey, focus on acquiring high-paying skills, building a strong portfolio, specializing in a niche, and crafting personalized proposals. Most importantly, stay persistent. Freelancing is a long-term game, but with the right approach, you can achieve financial freedom and live the life you’ve always wanted.

If you’re looking for a more in-depth guide on freelancing, I have a course that covers everything from building a portfolio to landing your first client. Check the link in the description to learn more!

Why Looker Studio Is Better Than Power BI

You know about PowerBI, a great data visualization tool. But you should know about Google Looker Studio’s biggest strength. This is not funny, ok? Let me explain why Looker Studio is better than Power BI for business intelligence. I have been working in business intelligence for over 5 years and have been associated with data for over 8 years. Now you can believe in my words because I know what I’m doing with data. This article is not going too deep, but I’ll show you enough so that you can understand why I’m saying Looker Studio is better than PowerBI.

Here I will decode two data factors about why Looker Studio is a hero.

You know about data time machines. Data depends on their value. But I think about other KPIs. Like Looker Studio is better than Power BI. Now I think about raw data. When I’m using Python NumPy to extract data values, it’s not easy because I have to write about 7 to 10 lines of code. But this is an easier thing.

Time-Based Data Management

You know every industry works for drag and drop or easy work. Like a data analyst needs any data set to be auto-included. Looker Studio automatically includes a date field for each query and applies a date range to the data by default. I have experience with PowerBI. When managing date fields and applying date ranges, PowerBI is quite complex and time-consuming. And I am sure every data analyst has had a bad experience with this. So I think for these things, Google Looker Studio is a hero.

Accessibility

Can you assure me of one thing? Which system is very easy to use, like cloud-based or PC-based? I think your first choice is cloud-based. I have experience with this. In my last data visualization project, I worked for 2 days. I was working in my home office. For some reason, I stayed at my friend’s home. I did not have my laptop with me, but I worked on my friend’s laptop. I just opened the laptop, logged into my Google account, and finished the Looker Studio project. Looker Studio is entirely cloud-based, allowing direct connections to online data without the need to download or install any software. On the other hand, Power BI is generally PC-based and requires installation for data connectivity.

This is the best choice for you.

Looker Studio offers nearly 1,000 different data source connectors and uses SQL, which is generally simpler than Power BI’s DAX language. As a Looker Studio expert, I can attest that while it may lack some advanced data modeling features, it effectively meets the essential requirements for business intelligence. Its intuitive interface and robust functionality make it a powerful tool for handling and visualizing data efficiently, even for complex business needs.

Finally, while both tools have limitations in their sharing capabilities, Looker Studio’s sharing process is simpler and more compatible with cloud-based data.

Overall, Looker Studio is an excellent tool for business intelligence in most cases. Although Power BI is powerful and ideal for those within the Microsoft ecosystem, Looker Studio is generally easier and quicker for beginners to learn.

Google Looker Studio may not be the first choice for data visualization, but when you work with SQL-based calculations, small projects, and Google’s product data analysis, Looker Studio is particularly well-suited for cloud-based data integration, ease of use, SQL-based calculations, and cost efficiency for smaller projects. Power BI, on the other hand, is ideal for complex data modeling, advanced visualizations, and integration within the Microsoft ecosystem.

Why Python is Important for Data Analysts

First things first, programming is much better than other tools. Similarly, Python programming is one of the most popular for data science compared to Excel and Power BI. At the beginning of my data analysis career, I used Excel and Power BI. But when I learned about Python programming for data analysis, I started using Python for my projects.

Programming allows you to solve all kinds of tasks effortlessly, whereas some tools can hinder you from doing any work. I’ve only used Python in my last three projects, and most current clients offer Python programs to use. Today, in this article, we will explore why Python is important for data analysis, and I will share my personal experiences with you.

Data Collection

Excel: You know Excel is widely used for data collection. When you think about data entry tools, Excel is the number one tool because it offers manual data entry with support for forms. Excel provides data organization support like sorting, filtering, and conditional formatting. When I first started my job, I worked in Excel, so I know it is a very good tool. Excel also provides basic analysis features like functions, formulas, and pivot tables, and you can do visualization with charts and graphs for basic data visualization.

Power BI: Power BI is a powerful business analytics tool. It is robust for collecting data and connects to various data sources like Excel, SQL Server, Oracle, Salesforce, SharePoint, and web APIs. From my personal experience, Power BI is a good tool for non-coders.

Python: Believe me, when I started programming for data analysis, I gained superpowers in the data analysis field. Python is a highly flexible and powerful language for data collection. You can collect data from virtually any source, including web scraping, APIs, databases, and files. Python has some excellent libraries for data collection, and I use Pandas. Really, Pandas is such a good tool for data collection.

Python scripts can be scheduled to run automatically, allowing for continuous data collection without manual intervention. This is a great process for a data analyst.

Excel and Power BI help a lot with data collection, but Python is suitable for large-scale data collection tasks. So, based on my personal experience, when you think about data collection, Python should be your first choice.

Data Cleaning

Data cleaning is a process that ensures data quality and prepares it for analysis. Python is a more helpful data-cleaning programming language than other tools. You need only 8 to 15 lines of code for data cleaning.

But with other data analysis tools, you might need to work in a more typical way. Cleaning data in Excel typically involves several steps to ensure data quality and consistency. The same is true with Power BI, where some processes have to be done to clean the data. But Python is the best way for data cleaning.

In my personal experience, when I used Excel for data cleaning, I faced many problems, especially with large datasets. Excel didn’t provide enough support for big data.

So, for data cleaning, Python offers you a superpower, and you can easily manage your data.

Data Cleaning Steps in Python:

  • Handling Missing Data: Identify and handle missing values by dropping, filling, or imputing them.
  • Removing Duplicates: Identify and remove duplicate rows in the dataset.
  • Data Type Conversion: Convert columns to appropriate data types for accurate analysis.

Data Exploration and Visualization

Data is powerful in the present world. When you analyze data, you need to see your growth, your potential, and more, which requires data visualization. Data visualization is a key aspect.

In my last project, my boss asked me about data structure. Data structure helps in identifying underlying patterns, trends, and relationships within the data. This is a part of data analysis.

Why Python is Better for Data Visualization

Python is considered a strong choice for data visualization. It has a rich ecosystem of libraries for data visualization. I use Python libraries like Matplotlib and Seaborn. These libraries are very user-friendly, and I think when you use these Python libraries, you don’t need other tools. At the start of my career in data analysis, I used Power BI, but now I think when you work with big data, Python should be your first choice.

Python’s visualization libraries provide extensive customization options, allowing users to tailor visualizations to their specific needs. I think this option is the best for every data analysis project.

We discuss three main points about data analysis: data collection, cleaning, and visualization. Each part is easy to do with Python, making it an excellent choice for data analysis.

As a data analyst, I have found Python to be an invaluable tool in my work, surpassing traditional tools like Excel and Power BI in several ways. Python offers significant advantages in three main areas of data analysis: data collection, data cleaning, and data visualization.

Data Collection: Python offers unmatched flexibility compared to Excel and Power BI. It allows you to collect data from various sources like web scraping, APIs, and databases using libraries such as Pandas. Automated scripts enable continuous data collection without manual effort, making Python perfect for large-scale tasks.

Data Cleaning: Python simplifies data cleaning with minimal code, handling missing data, removing duplicates, and converting data types efficiently. Unlike Excel and Power BI, Python handles large datasets seamlessly, ensuring high data quality.

Data Visualization: Python’s libraries like Matplotlib and Seaborn provide extensive customization options for tailored visualizations. Compared to Power BI, Python is more suitable for big data projects, offering superior visualization capabilities.

How to Become a Freelance Data Analyst in 2024

Wake up early in the morning, then get ready to go to the office. And you have to enter the office before 9 o’clock. If you are a little late, the boss will scold you. And you have to come back home from the office in the evening. Actually, it was a very boring job for me. I was searching for its solution and finally I found its way. I know about freelancing. Because I am a data analyst and I used to work on data analysis. That’s why I started freelancing with data analysis.

Now I can go to the places I want, work as I want, and I can go to different types of contracts with clients. There have been days when I have completed a task in three days that I used to complete in five days. The point is that you can do the work in an interesting way that you can do very quickly. And when you work with data, you need to keep a cool head. Because when you extract an important insight from the data and make business future plans accordingly. I think freelance data analysis will take you in a much better direction.

So I want to share my personal experience with you How to Become a Freelance Data Analyst in 2024.

How do you prepare for freelance data analysis?

You are well aware that the data arena is a vast ocean. There are different types of work such as some do only data cleaning and collecting and some work with BI tools. Or are there any companies out there that only work with Excel. For example, I was working on a project a few days ago where there was only an opportunity to do data analysis with Python. That’s why you first need to figure out what kind of data analyst you are. And what types of data analysts are in demand in the market.

Freelancing is difficult for me as a data analyst

There may be many data analysts like you who want to do this freelancing, but if you don’t have enough portfolio or projects then you will lose against them. As at first I also lost. I could not pick up any freelancing projects for 20 days because my portfolio was not strong. When I posted for a job on Upwork, Klind didn’t respond to me. Then I offer a few projects for free and I build the portfolio. Then it became easy for me to get projects.

Build Portfolio for Data Analyst

  • Personal Projects: Work on passion projects to showcase your skills. You can find open-source datasets online to practice data cleaning, analysis, and visualization. If you’re a data analyst, you know where data comes from. You try to pick up the raw data and create the project. And he will make an overview video of the project which he will try to share on various social media.
  • Freelance Platforms: Consider creating profiles on Upwork, Fiverr, or niche freelancing platforms to build an online presence.
  • Case Studies: When working with freelance clients, create compelling case studies that highlight the problem you solved, your approach, and the results achieved. These techniques have worked very well for me. So tell me, if you are looking for someone to do data analysis for your company, what aspects of a freelancer would you look for?

Promoting your work as a Data Analyst

In the current era of competition, those who can create their own brand or increase their brand value, but go ahead with their business. And so you too keep promoting your work to your targeted clients. Keep discussing various business problems. Create overview videos on projects you’ve done and share them on social media. So that your targeted can see your projects and hire you.

For example, LinkedIn may be a good opportunity for you. So try to post your work on LinkedIn every day. You can open a YouTube channel where you can showcase your data analysis projects. Can tell about various tips and tricks of analysis. Meaning you have to convince the front man that you are a good data analyst.

Being a freelance data analyst also requires you to be patient. Because in a few days you may not get the project. Like in my case for the first 20 days, I didn’t get any project after trying hard. And for that, keep doing the steps I showed you above in your daily life.

How to Practice Data Analysis as a Beginner

Data analysis is a field that helps every business or organization make informed decisions. For that, a data analyst needs to perform data analysis properly. After learning the skills of a data analyst, their job is to practice with data, experimenting with different datasets. Today, we will explore how to practice data analysis as a beginner. Before I got my first data analyst job, I worked on about 20 projects, and in each project, I discovered valuable insights related to real-life data.

However, those who have just started mastering data analysis skills may need access to real-life data, and no business will provide them with data for practice. But you can easily work with real data if you want. Working with real data is essential to provide valuable insights.

Today, I will share my practical experience and knowledge on how to practice data analysis as a beginner.

Data Analysis Practice with Excel

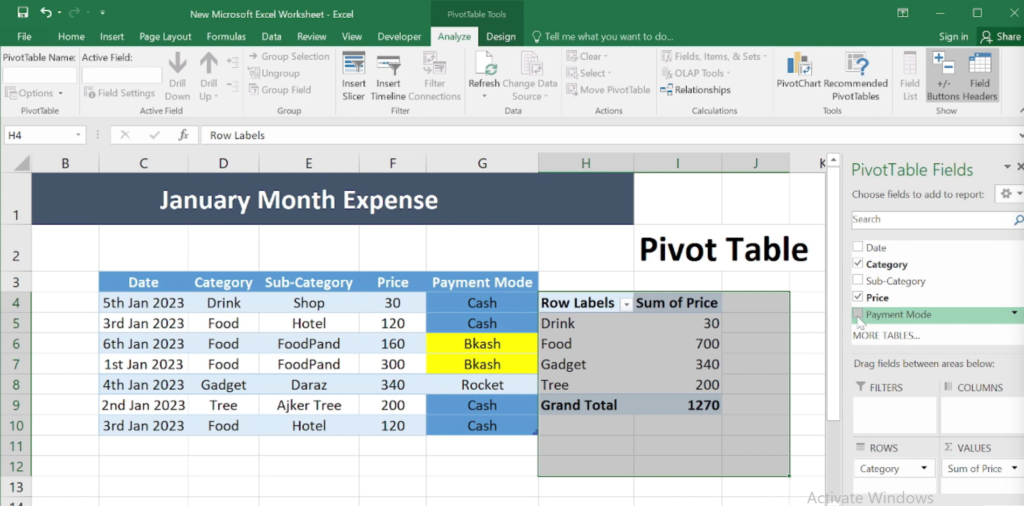
Excel is a fantastic tool for data analysis and is often considered the first tool to learn. In my case, I also learned Excel for data analysis, and I still use it every day. To become a good data analyst, it is crucial to know the fundamentals of Excel and practice data analysis using it. I will explain with an example of how to practice data analysis with Excel.

In the image above, we can see some data that I have organized in a pivot table. Although this is an example, the function of a pivot table is to summarize large amounts of data, which is a key aspect of data analysis.

As we can see, the pivot table allows us to find the sum of the products in a category with just one click.

Let me show you a small example. You can work with different types of data to practice data analysis with Excel and create a project as you work with each dataset. By doing this, you can use these projects as part of your portfolio.

Data Analysis Practice with Power BI

Power BI is a data visualization tool. You might wonder why use Power BI when Excel also offers data visualization. Power BI offers a user-friendly interface that caters to both data analysts and business users with varying technical backgrounds. Excel can be intimidating for non-technical users, while Power BI facilitates the creation of reports and visualizations without extensive coding knowledge.

I now use Excel for the visualization of small datasets, and when I work with big data, I use Power BI to visualize it.

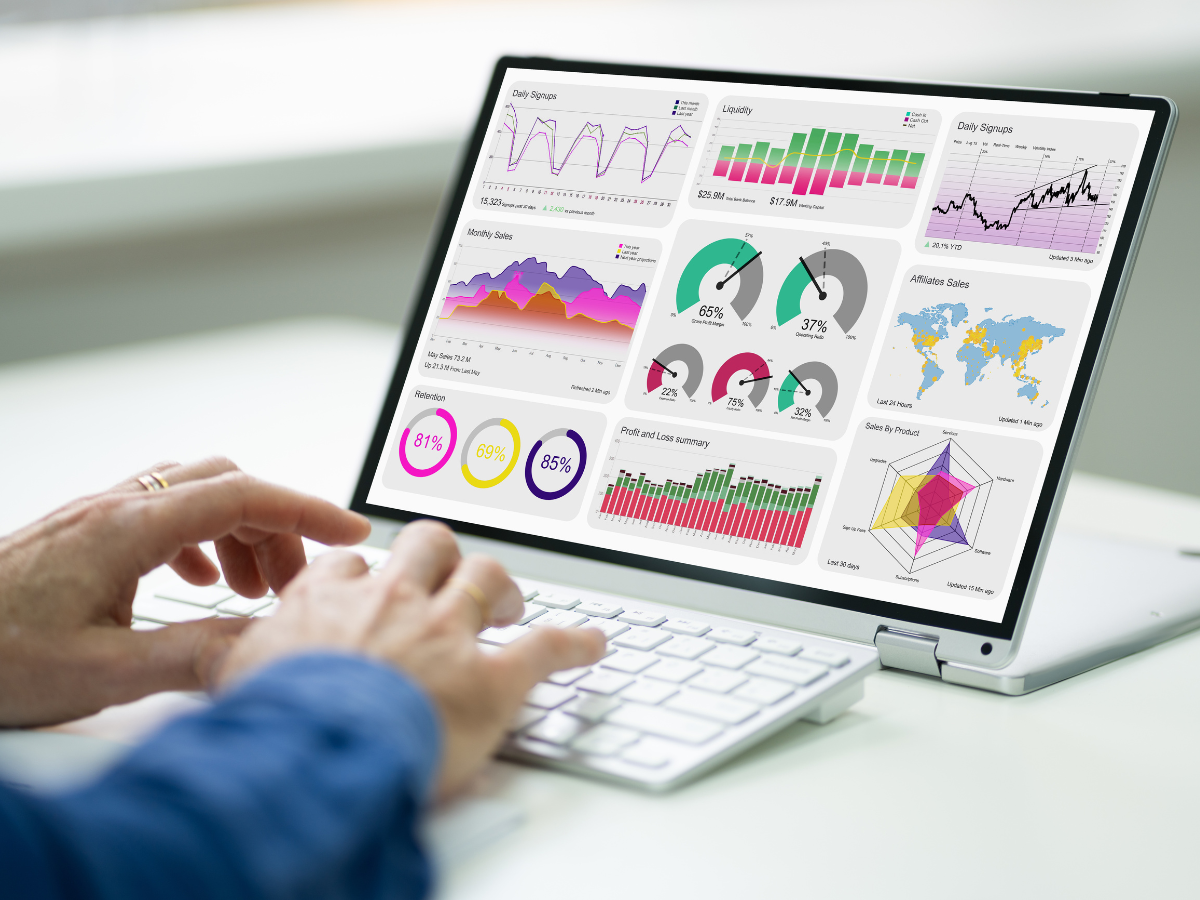
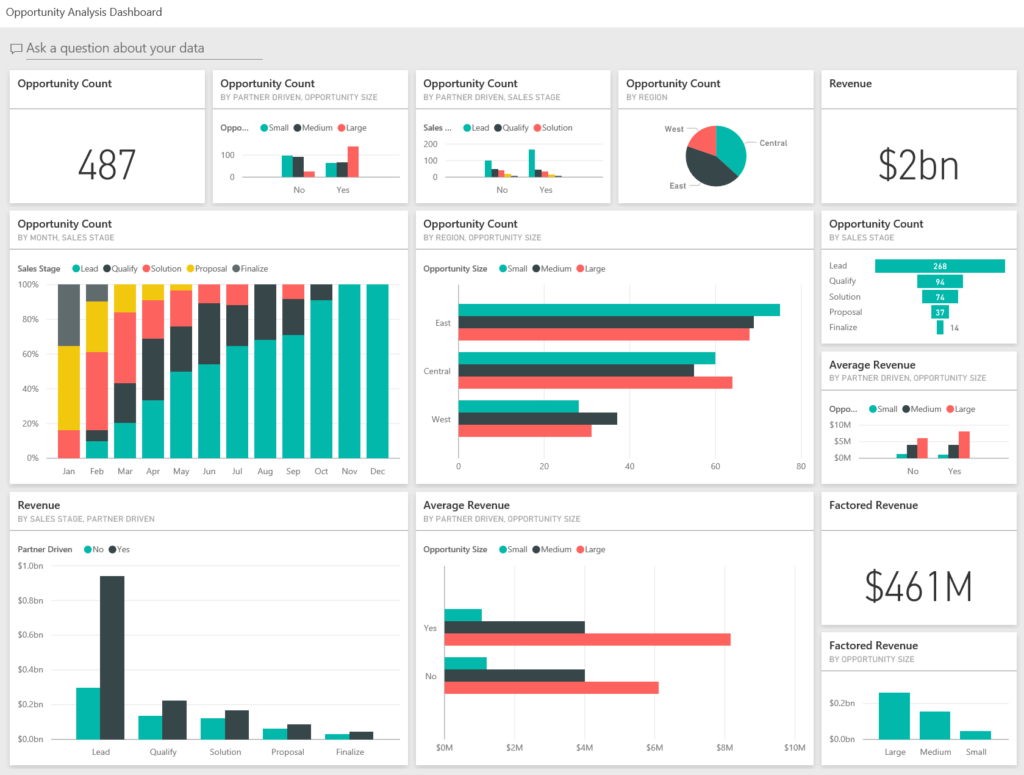
Above, we see a business-oriented dataset in visualized form. There is usually not a lot of data here. You can take such raw data and visualize it. Power BI boasts superior data connectivity compared to Excel. It connects to a wider range of data sources, from cloud databases and CRM systems to Excel spreadsheets. In terms of data connectivity, Power BI is a few steps ahead of Excel.

Data Analysis Practice with Python

Python is an excellent choice for data analysis. Programming can make any task more convenient, and Python is a powerful tool for data analysis. By programming, you can analyze data very easily.

First, you will need to master Python programming. Start with small datasets and try to analyze them. Then, you need to understand the Data Analysis Workflow. Practice repeatedly to become efficient with data.

Python offers several libraries for data analysis:

NumPy: This library excels at numerical computing, allowing you to work with arrays and matrices efficiently.

Pandas: This library is essential for data manipulation and analysis.

Matplotlib & Seaborn: These Python libraries help with data visualization. Matplotlib provides a foundation for creating various charts, while Seaborn builds on top of Matplotlib, offering high-level functions for creating attractive and informative statistical graphics. Practice creating different chart types like bar charts, histograms, scatter plots, and box plots to visually represent your data insights.

In the above discussions, we have explained how to practice data analysis. You can create a project in each case. For example, if you want to practice Excel data analysis, you can create a complete project that you can use as part of your portfolio.

Which degree helps you land a Data Analyst Job?

Is a college degree really important to become a data analyst? Many people ask me such questions. For example, a few days ago, a friend of ours was looking for a job in data analysis. He, however, started learning the skills of data analysis as per my guidance, and after mastering the skills, he began job hunting. At that time, he asked me a similar question about which degree certificates he should add to his CV to secure a data analysis job. Most of the data analysis job circulars I receive mention degrees, but when a company hires a good data analyst, they don’t focus solely on degrees. Instead, they assess how well an employee can analyze their data.

Last week, a company contacted me as a recruiter to hire a data analyst. The two analysts I hired for the company did not hold degrees. They secured their positions based solely on their knowledge and experience. However, having a degree in computer science or statistics undoubtedly distinguishes you in the eyes of data analysis recruiters. Nevertheless, even without such a degree, you can excel in the field of analysis.

What do data analysts actually do?

Data analysts analyze a company’s data and assist in making crucial decisions.

  • Data Collection: They gather data from various sources, such as surveys, website traffic, or company databases.
  • Data Cleaning and Wrangling: Real-world data is often messy, so analysts spend time cleaning it up by rectifying errors and inconsistencies.
  • Data Analysis: This is where the magic happens! Analysts use statistical methods and tools to uncover patterns and trends in the data.
  • Data Visualization: They create charts, graphs, and other visuals to convey their findings to non-technical audiences.
  • Communication and Storytelling: Data analysts don’t just crunch numbers; they elucidate their insights to stakeholders, aiding them in making data-driven decisions.

Now, you may wonder whether a data analyst needs a higher degree to perform these tasks. In my three years of experience, I have never found such a degree necessary. As a company recruiter, when I hire a data analyst, I don’t prioritize degrees; I focus on knowledge and experience.

However, if you hold a degree in Statistics, Mathematics, Computer Science, or Business, or have studied these subjects, you have a slight advantage in data analysis. Such degrees allow for a deeper dive into data analysis. Nonetheless, I’m not implying that possessing these degrees is mandatory for securing a job.

Let’s delve into how these degrees benefit a data analyst.

Statistics Degree for Data Analysis

Statistics is indispensable in data analysis, but obtaining a degree in it isn’t obligatory. For instance, the statistical support I require for my daily data analysis aids me in analyzing data more effectively, identifying patterns, trends, and relationships across different data types. Statistics furnishes the framework for constructing models to forecast future trends. In essence, a statistics degree equips you with a robust analytical toolkit for working with data.

Mathematics Degree for Data Analysis

In most cases, data manifests as numbers, where mathematics plays a pivotal role in computations. However, a grasp of basic mathematics suffices for proficient data analysis. While an advanced degree in this field allows for deeper exploration, it’s not imperative. Mathematics nurtures critical thinking, logical problem analysis, and the ability to deconstruct problems into manageable components.

Computer Science Degree for Data Analysis

The realm of data analysis hinges on computer science. As all data analyst tasks are computer-based, familiarity with various computer tools is paramount. In practice, many proficient individuals lack a degree in computer science but possess comprehensive computer knowledge. Nonetheless, holding a degree in computer science may confer a slight advantage in data analysis. Proficiency in programming languages such as Python, R, Java, and SQL, gained through computer science programs, propels you ahead in data analysis. These skills are instrumental in data manipulation, analysis, automation, and constructing data pipelines.

Business Degree for Data Analysis

Considering that data analysis serves businesses, possessing a degree in business can offer insights into leveraging data for organizational enhancement. Business knowledge aids in translating raw data into actionable insights, addressing specific business challenges, and contributing to strategic decision-making.

In conclusion, based on practical knowledge and experience, I believe that degrees don’t significantly impact your success in data analysis. However, in some scenarios, such degrees can foster deeper insights into data. Nevertheless, lacking such advanced degrees doesn’t hinder your potential as a data analyst.

Which soft skill should you know as a data analyst?

You might think that my work is only about data. So why should I learn soft skills for data analysis? Because I will analyze the data and from that data, I will create a dashboard, and the company will make the decisions they want based on my dashboard, improving the business. This same kind of thought came to me at the beginning of my data analysis journey, and I also wondered if extra soft skills are important for me. Today, we will know the answers to all these doubts and questions and understand which soft skills you should know as a data analyst. So first, we need to understand why soft skills are important for data analysis.

Why are Soft Skills important for Data Analysis?

Suppose you leave your house and head to the city, using different vehicles and changing cars at various points. How do you fully experience this journey? How do you navigate the city easily?

For instance, when you switch to a different car, you inquire if it will take you to your destination, ask about the fare, and assess the condition of the city you’re heading to. Asking these questions demonstrates two things: communication and presentation skills. Undoubtedly, these skills make your journey easier. Similarly, you need such soft skills when dealing with data.

Because at the end of the day, a data analyst identifies business opportunities or solves problems, and for this, soft skills are crucial.

As a data analyst, I can attest that soft skills are invaluable in my daily work. Let’s discuss the soft skills a data analyst needs based on my practical experience.

Analytical thinking: A cornerstone for Data Analysis

Analytical thinking is crucial for a data analyst. After cleaning the data, when presented with it, you must think about how to analyze it to extract important insights. A proficient data analyst can approach data from different angles with analytical thinking.

By honing analytical thinking skills, data analysts can effectively derive meaning from data, turning it into valuable knowledge for informed decision-making.

Communication skills for Data Analysts

Data analysts do more than crunch numbers; they uncover insights crucial for businesses. Communication is vital for this. Understanding the business context, analysts don’t work in isolation; they need to grasp business goals and challenges to translate data into actionable insights. Clear communication enables them to ask the right questions.

Communication skills act as a bridge between the technical world of data analysis and the practical world of business impact.

Presentation Skills for Data Analysts

Data analysis holds immense importance for businesses in this data-driven world. A data analyst uncovers hidden opportunities within business data. However, these insights are only valuable if effectively communicated. This is where presentation skills become vital.

Creating dashboards with various charts and graphs allows businesses to easily understand their data situations. Presentation skills are crucial for data analysts to present analyzed data to business stakeholders and derive decisions from it.

By honing presentation skills, data analysts can transform complex data into presentations that inform, engage, and inspire action.

Problem-solving skills for Data Analyst

Data analysis involves solving business problems. Strong problem-solving skills enable data analysts to approach challenges systematically and develop data-driven solutions. Before conducting each data analysis, I consider how it will solve a business problem, taking notes, identifying insights, and uncovering new business opportunities.

Adaptability Skills for Data Analyst

Data analysis is a vast field that constantly evolves with new tools and technologies. It’s essential to adapt to new tools and skills as technology advances. Starting my data analysis journey with Excel, I now work with programming languages, having learned various tools over two years through practice.

New data analysis tools and technologies emerge frequently, necessitating continuous learning and adaptation to stay updated.

Networking Skills for Data Analysts

Networking is crucial for data analysts based on my experience. All the jobs and projects I’ve secured have been through networking. Building a strong network with other data analysts helps in staying updated on various issues and seizing opportunities.

By now, you must realize how much these soft skills can enhance your data analyst career. The truth is, you don’t have to spend much time learning these skills; set aside some time each day to improve them. This article explores which soft skills you should know as a data analyst. Keep advancing your career. Thank you.

Can data analysts work from home?

I think you have good experience with technology, and we know that a data analyst analyzes data and extracts insights from it to help businesses make decisions. All these activities can be done virtually by a data analyst. So, we can say that all the activities of a data analyst can be done remotely. A data analyst can sit anywhere or work from a home office very easily.

If I talk about myself, I am currently working two jobs. In the first job, I only work three days a week, and in the second one, I work from a home office. In this job, I have to spend 4 hours a day. To understand this, let me explain a little. If an employee has to come to the office to work, then in that case, a company incurs more expenses. When an employee works from home, it means that they can work from anywhere at a certain time, and the cost to a company is relatively low. For example, I work virtually or remotely for a company in Australia. I work 5 days a week, and it takes 4 hours a day. In this case, I can also work very easily, and the company does not have to spend extra on me.

How is remote/work-from-home data analysis done?

When I started to understand data analysis, I learned about how this analysis can be done remotely. You might think that there are no extra skills to learn. However, there are one or two tools you need to learn to connect to an office virtually. For example, you need to learn tools like Zoom or Google Meet, and how you can connect. You don’t need to spend much time learning them; you can learn from YouTube.

But in some work, you may need to share your computer screen, so you can learn about remote desktop. You don’t need to learn anything extra to do remote data analysis. But I think that remote or work-from-home data analysts can do all the work comfortably. Like if I talk about myself, when I go from my home to my office, it costs me an extra hour and a half for commuting every day. And I don’t spend much extra time doing home office work.

What are the procedures to be followed for remote Data Analysis?

For example, in the company I work for, about 30% of the company’s decisions depend on my data analysis. So I have to do everything perfectly.

1. Understanding the problem:

  • I try to solve one problem a week. First, I share the data movements with the company boss and my colleagues. Then we discuss project goals with clients or colleagues, likely through video conferencing or collaboration tools.

2. Data Acquisition:

  • At this stage, I might use secure cloud storage, company VPNs, or internal data portals to retrieve the necessary datasets.
  • Sometimes, you might use SQL queries to extract specific data from databases.

3. Data Cleaning and Wrangling:

  • In most cases, the data is found in a messy state. So, the data has to be cleaned. I try to clean the data and create the correct formats.

4. Analysis and Modeling:

  • I use programming languages like Python and Excel to analyze the data, identify trends, and potentially build models.

5. Visualization and Communication:

  • Data visualization or creating a perfect dashboard is very important. I use Power BI for my remote data visualization. With this data, we discuss what kind of decisions we can make.

Skills for Remote Data Analysts

In the points on how I analyze data for my company, I have analyzed what tools to use for remote data analysis. Apart from the technical skills like SQL, Python, and data visualization tools, remote data analysts need strong communication and time management skills to excel in a work-from-home environment.

Overall, remote data analysis offers flexibility and leverages the power of technology to get the job done!

How many hours does a data analyst work?

Generally, work-from-home data analysts spend 6 to 8 hours. For example, a friend of mine does data analysis for a company in Jordan. He has to spend 7 hours every day and works five days a week for that company. But the more experience you get, the fewer your working hours will be. Like I spend four hours.

How can you find work-from-home data analyst jobs?

If you have proper data analysis skills and knowledge, you can easily get work-from-home data analyst jobs. But to get a work-from-home data analysis job, you have to knock on the right door. However, some platforms including LinkedIn offer these work-from-home jobs.

Here are some ways you can find work-from-home data analyst jobs:

Remote Job Boards:

  • FlexJobs: Focuses on remote and flexible work opportunities, including data analyst jobs [FlexJobs data analyst jobs].
  • Remote.co: Another platform listing remote positions, where you can search for data analyst positions specifically.
  • Indeed: Major job board with filters for remote work, search for “data analyst” and filter for “work from home” or “remote.”
  • LinkedIn: There are many job postings on LinkedIn internationally. So, Optimize your LinkedIn profile, and many companies will start reaching out to you.

Freelance Platforms for work-from-home data analysis jobs

Once you know about all the systems of data analysis, you can easily do data analysis projects on these freelancing platforms and gain a lot of experience. Generally, good work is available for data analysis on these two platforms.

  • Upwork: Connects freelancers with clients, where you can create a profile highlighting your data analysis skills and find project opportunities.
  • Fiverr: Similar to Upwork, it allows you to offer freelance data analysis services. I work on Fiverr myself and charge $250 per project.

Is a Portfolio or Project important to get a work-from-home data analysis job?

A portfolio or project will help you a lot in getting the first job. If you have completed two projects, you can show the job recruiter those projects, and they can judge you based on them. If you’re new to data analysis or coming from a different field, a portfolio can bridge the experience gap. You can include personal projects, volunteer work, or coursework that demonstrates your capabilities.

Investing time in building a strong portfolio can significantly increase your chances of landing that work-from-home data analyst job.

Work-from-home Data analysis job pros and cons

As someone who does physical data analysis and works from home as a data analyst, I can give you a perfect idea about it.

Pros:

  • Flexibility and Work-Life Balance: You only have to work during office hours; you don’t have to spend much time commuting to and from the office. Work can be done from anywhere.
  • Access to a Wider Job Market: You’re not limited to companies in your area. You can search for remote data analyst positions across the country or even globally.
  • Increased Productivity: Some people find fewer distractions at home and can focus better, leading to increased productivity.
  • Location Independence: You can work from anywhere with a good internet connection, allowing you to travel or relocate without sacrificing your career.

Cons:

  • Lack of In-Person Interaction: Collaboration and team culture can be harder to establish remotely.
  • Work-Life Boundaries: Work can become monotonous, as in a physical office, you can collaborate with your colleagues and have a good time.
  • Communication Challenges: Remote work relies heavily on technology and clear communication. There can be misunderstandings due to a lack of face-to-face interaction or time zone differences with colleagues.

Conclusion

Ultimately, whether a remote data analyst job is right for you depends on your personality and work style. If you value flexibility, independence, and the ability to work from anywhere, it might be a great fit. But speaking from personal experience, in my case, work-from-home data analysis seems more interesting. Because I don’t have to make any separate preparations for it, I don’t have to spend time going to the office, and I don’t have to follow any formalities. I hope you will also enjoy this job.

How Can I Hire a Good Data Analyst?

If we look online or on social media, everyone claims to be a good analyst. But few can actually do actual work or analyze data well. One can bring out an insight. Or can make a decision from any data. Such people are rarely found. For example, last month, I was working as a data analyst job recruiter for a company. To be honest, when we created the job applications and released them to the market, we received about 400+ applications. The first time, we cut 300 people based only on skill and knowledge.

You can find the explanation of why I left it at the end of this article. As a recruiter, I can see that there are many data analysts in the market. Many claim to be good data analysts. But the number of actual good quality data analysts is very low. Finally, when we called for interviews, we called 12 people for interviews. And finally, when we selected three people, even after selection, we can see that there are many gaps in their education.

Many people think that they will become good data analysts by learning the tools of analysis. But not really. To be a good data analyst, you need some soft skills. That will help you make decisions from data.

What do data analysts actually do?

If I try to explain it to you very simply, a data analyst acts as a bridge between a business and making business decisions. Today, the entire world depends on data. A business, therefore, generates a lot of data. And when a business starts making decisions from this data, what it did in the past and what it has to do in the future, when it starts making such decisions, it will grow the business very well.

And for this, a data analyst has to adopt some methods:

  • Data Collection: Data analysts gather information from various sources, which can involve conducting surveys, scraping data from websites, or purchasing datasets from external vendors.
  • Data Cleaning and Wrangling: Raw data is often messy and inconsistent. Data analysts clean and organize the data to ensure its accuracy before analysis.
  • Data Analysis: Once the data is clean, analysts use statistical techniques and data visualization tools to identify patterns, trends, and anomalies.
  • Communication and Storytelling: Data analysis is all about turning numbers into insights. Analysts create reports, dashboards, and presentations to communicate their findings to both technical and non-technical audiences.

When a good data analyst adopts these methods, he can easily make good business decisions. For example, in the company where I am working as a data analyst, 60% of the company’s decisions are made by my data analysis.

Why Project Is Important for Data Analytics

From my personal experience, I can say that a project or portfolio is more important than a certificate for a data analyst job. When you go for a job interview, if you can show three to four projects, the job recruiter will get a positive impression of you. A good data analyst looks at at least three projects.

Generally, a data analyst has three projects like:

  • Web scraping.
  • Data cleaning.
  • Data Visualization.

If one can make projects on these three things in the beginner stage, then he can easily claim himself as a good data analyst.

Web Scraping

Web scraping can be a valuable tool for data analysts, allowing them to collect large datasets from websites for analysis. Identify the data points you want to extract. Browse the website and familiarize yourself with the structure. By doing such things, you can use web scraping in your project.

Data Cleaning

Data cleaning is the essential process of preparing data for analysis by identifying and correcting errors, inconsistencies, and missing information within a dataset. It ensures the data you’re working with is accurate and reliable, leading to trustworthy analysis and conclusions.

Data Visualization

Data visualization is the art of transforming raw data into visually appealing and informative graphics that clearly communicate trends, patterns, and relationships within the data. It’s a powerful tool for data analysts and anyone who wants to make sense of information.

Data Analyst Soft Skills

Learning the tools alone will not make you very good in the tech world. You must focus on soft skills just as you need to have skills in data analysis. Data analysts need a strong combination of technical skills and soft skills to be successful. I think soft skills help you to be a good data analyst.

  • Communication: Being able to clearly and concisely explain complex data findings to both technical and non-technical audiences is crucial. Communication is fundamental for data analysts. Understand your audience’s technical background. Use clear, concise language for non-technical audiences.
  • Collaboration: Data analysts rarely work in isolation. They collaborate with colleagues from various departments, such as marketing, sales, and engineering. When you work as a team, you can share your valuable opinions on anything. This allows you to go deeper into the data.
  • Problem-Solving: Data analysis is all about solving problems. Above all, a data analyst finds business problems and solves them. For this, it is very important to have problem-solving skills as a soft skill.

By mastering these soft skills, you can transform data from raw numbers into a powerful tool for driving informed decisions and achieving positive outcomes.

If you want to hire a data analyst, then follow these methods. And if you want to make yourself a data analyst, then follow all these things above and make yourself a good one. It is not a very difficult task. All you have to do is sort it out.